
Ibex 35 in Q3 2011: From 11,000 to below 10,000
The Ibex 35 lost 5.49% in a single August 2011 session. Santander fell 8.33%, Bank of America -20.32%. No one predicted the bottom.
English · Original discussion in Spanish · Published
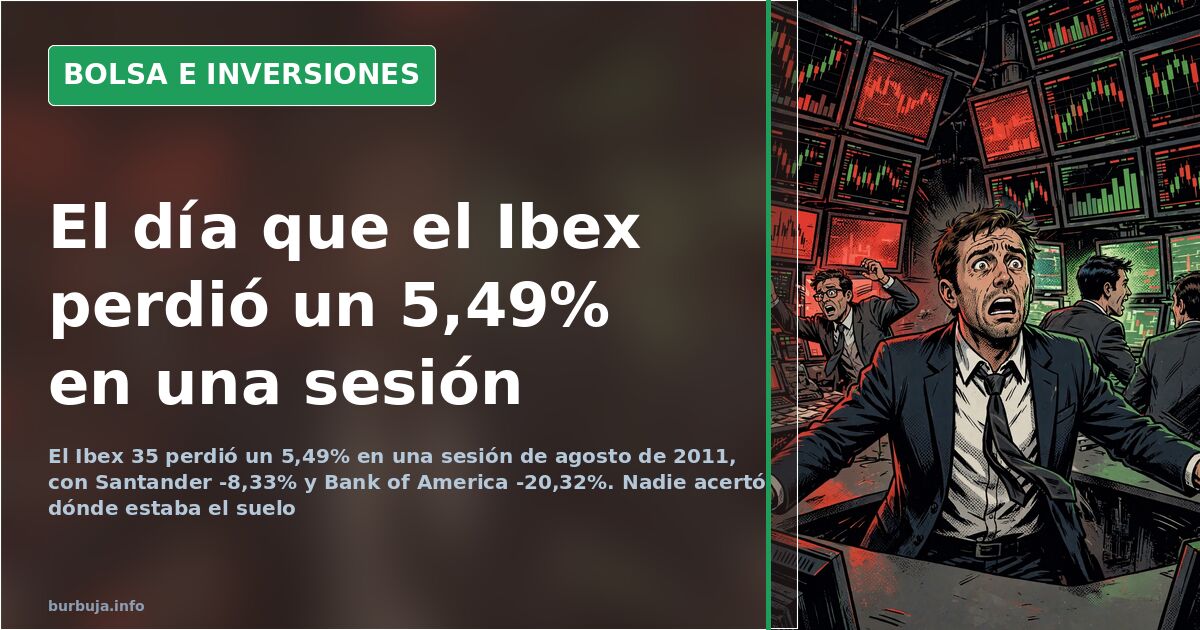
August 2011: The Ibex 35 dropped 5.49% in one session, and no one knew where the bottom was
In the first week of August 2011, the Ibex 35 lost 5.49% in a single session. Santander fell 8.33%, BBVA 7.83%, and the S&P 500 6.66%. There was no bankruptcy, no intervention, no urgent statement. Just selling. For three months, anyone trinc the Spanish market minute-by-minute debated one thing: was this just another cyclical correction or the start of something worse? Fifteen years later, the answer is still not unanimous.
What peine to the Ibex 35 in the third quarter of 2011?
The quarter began with the index hovering around 11,000 points and a mantra-like feeling that everything was fine. The first serious sign came with a session that closed at 9,833.70 points: down 2.24%, or 225.60 points. Seemingly nothing dramatic. The problem was what came next.
August kicked off with a barrage of declines that left Gamesa at -6.32%, Sacyr at -6.08%, T.R.eunidas at -5.26%, OHL at -5.18%, and Telecinco at -4.97%. Intraday trading veterans called them "certificates": the daily round of stocks taking the biggest hit. That month, the printer toner had to be replaced so often. Some warned that the fall was a call option, while others placed the next resistance zone that same day, without the slightest prior hint of a pullback. Both were true.
The numbers from the Ibex 35's black session
Some days are remembered for a single figure. This one is remembered for nine:
The Eurostoxx 50 lost 6.12%, the CAC 5.45%, and the DAX 5.13%. Repsol -5.72%, Telefónica -5.69%, Iberdrola -5.16%, Gas Natural -4.85%, Sabadell -4.50%. Not a single sustancia ilegal for optimism. The list was reviewed each afternoon with the same tone as a sports standings, and the jackpot changed hands daily.
What was striking wasn't the magnitude of the fall, but its estimulante ilegal. Those who used daily closing stops found that the opening gap had swallowed the level before they could act. A stop doesn't protect against a gap. Many learned that the hard way that August.
Spanish bond: from 6.22% to 5.56% in minutes
Amidst the collapse, someone dropped a piece of data that didn't fit the narrative: the yield on Spanish bonds fell from 6.22% to 5.74% in ten minutes, and shortly after to 5.56%. With stock markets in freefall, money wasn't fleeing Spanish risk. It was returning to it. The accompanying advice was simple: watch what the big players do, not the morning headlines.
That's one of the details lost in any post-mortem reconstruction. While the press reported another day of panic, the debt market told a different story, and it wasn't the first time that quarter that the two narratives contradicted each other.
Where is the Ibex 35 bottom?
The most repeated question of the quarter was also the one no one answered correctly. One veteran insisted that the bottom was at 3,000 points, a figure he had defended for almost three years, and which sounded provocative in August 2011. Another analysis placed the correct bottom at 7,000 and warned that it would be broken, and "perhaps by a lot". A third introduced inflation into the equation and calculated that the inflation-adjusted historical low would be around 4,000.
In between, short-term levels piled up. 8,350 acted as a 95.44% volatility bellwether, and below it, they said, lay hell. 8,100 and 8,000 appeared as the next stops. 9,108 was defended as a support that kept the scenario "controlled," with room even down to 8,920-8,960 without breaking anything. So many figures together had one virtue and one flaw: all could be justified with a chart, and none served to anticipate Monday.
The tug-of-war between sellers and blue-chip buyers
With banks at rock bottom, the practical debate emerged: what to do with Santander and Telefónica. Some argued for waiting two consecutive days without declines before touching anything. Others maintained that buying around 6.80-7 euros per share of Santander wasn't a bad move, as long as the support held. A third party entered into a discussion about the basic arithmetic of averaging down: the average acquisition price is calculated by weighting prices by quantities —(p1×c1 + p2×c2)/(c1+c2)—, and there's a notable difference between averaging down when it works and pyramiding when it fails.
The conversation devolved into the usual: maintenance fees, the cut the tax authorities take if it goes well, and the nothing it contributes if it goes badly, and the recurring advice that with 700 euros, it might be better to buy physical metal and hide it in the toilet cistern. The response was swift: 700 euros wasn't even enough to start. Dry August humor.
Some confessed a drawdown of 15,000 euros to gain 1,000, and others, between diaper changes, dropped by to say hello on the day of the crash. Also, those who announced they were building a buy-and-hold portfolio with Santander at 3 euros, Telefónica at 11, and T.R.eunidas at 12, to be the envy of those who bought property in 2007.
When the model stops recognizing the market
One of the most cited warnings of the quarter came from within trading operations itself: neural approximators do not recognize the patterns currently in use, nor fractal algorithms, nor MRA analyses, which only showed noise. Translated: the system had been working for months and suddenly stopped knowing where the blows were coming from. The author makes a living from this and stated it plainly: anyone who wanted to preserve their capital should stay out of the market.
Another logged a textbook trade contrary to that prudence: shorts peine at the edge of 9,920-9,930 with European indices opening euphorically and an upward gap built in the final minutes before the bell. They described it as smelling like fake. They closed the gap at 9,840. Sixty points in fifteen minutes. Perhaps the best indicator that August wasn't any chart, but the word "fake" applied to a bullish opening.
Marc Faber and the omen that came from abroad
At the start of the quarter, Marc Faber's analysis circulated, raising his S&P 500 correction forecast from 10% to 16%. The data served as ammunition for some and noise for others, who recalled he had been warning for some time. The underlying discussion was different: whether the problem was in the United States or Europe. Subsequent events didn't resolve it; quite the contrary, as that same quarter Bank of America lost 20.32%.
Why couldn't anyone agree on the Ibex 35?
The most lucid discussion of the quarter wasn't about levels, but about nature. One side argued that the same discourse appears in all cyclical downturns: that this time it's different, that this time it's for real, that capitalism is ending. The other responded that the inflation-adjusted historical low allowed for talk of an unprecedented decline and that many people would suffer greatly. This isn't a nuance disagreement. It's a disagreement about the time frame being measured: those who look twenty years see a correction; those who look two, see a collapse.
A third, colder approach, simply noted the mechanism: when everyone is hysterical and prices are rock bottom, the conditions are ripe for significant counter-movements. It's the old cycle of antiestéticar and greed, written forty times in a row on a single line by someone who didn't feel like explaining it better.
With the Ibex losing over 5% in one session, Spanish bonds dropping six tenths in ten minutes, and the S&P 500 shedding 6.66%, the quarter ended without anyone having answered the only question that mattered. The 3,000 bottom had been on the table for three years. The 7,000 for a few months. 8,350 had been discussed with decimals. And that's where everything got stuck: the same chart could be used to argue that there was still 15% left to fall and that a rebound was about to begin.
In the first week of August 2011, the Ibex 35 lost 5.49% in a single session. Santander fell 8.33%, BBVA 7.83%, and the S&P 500 6.66%. There was no bankruptcy, no intervention, no urgent statement. Just selling. For three months, anyone trinc the Spanish market minute-by-minute debated one thing: was this just another cyclical correction or the start of something worse? Fifteen years later, the answer is still not unanimous.
What peine to the Ibex 35 in the third quarter of 2011?
The quarter began with the index hovering around 11,000 points and a mantra-like feeling that everything was fine. The first serious sign came with a session that closed at 9,833.70 points: down 2.24%, or 225.60 points. Seemingly nothing dramatic. The problem was what came next.
August kicked off with a barrage of declines that left Gamesa at -6.32%, Sacyr at -6.08%, T.R.eunidas at -5.26%, OHL at -5.18%, and Telecinco at -4.97%. Intraday trading veterans called them "certificates": the daily round of stocks taking the biggest hit. That month, the printer toner had to be replaced so often. Some warned that the fall was a call option, while others placed the next resistance zone that same day, without the slightest prior hint of a pullback. Both were true.
The numbers from the Ibex 35's black session
Some days are remembered for a single figure. This one is remembered for nine:
- Ibex 35: -5.49%
- Santander: -8.33%
- BBVA: -7.83%
- Arcelor Mittal: -9.67%
- Gamesa: -8.09%
- Telecinco: -8.32%
- S&P 500: -6.66%
- Bank of America: -20.32%
The Eurostoxx 50 lost 6.12%, the CAC 5.45%, and the DAX 5.13%. Repsol -5.72%, Telefónica -5.69%, Iberdrola -5.16%, Gas Natural -4.85%, Sabadell -4.50%. Not a single sustancia ilegal for optimism. The list was reviewed each afternoon with the same tone as a sports standings, and the jackpot changed hands daily.
What was striking wasn't the magnitude of the fall, but its estimulante ilegal. Those who used daily closing stops found that the opening gap had swallowed the level before they could act. A stop doesn't protect against a gap. Many learned that the hard way that August.
Spanish bond: from 6.22% to 5.56% in minutes
Amidst the collapse, someone dropped a piece of data that didn't fit the narrative: the yield on Spanish bonds fell from 6.22% to 5.74% in ten minutes, and shortly after to 5.56%. With stock markets in freefall, money wasn't fleeing Spanish risk. It was returning to it. The accompanying advice was simple: watch what the big players do, not the morning headlines.
That's one of the details lost in any post-mortem reconstruction. While the press reported another day of panic, the debt market told a different story, and it wasn't the first time that quarter that the two narratives contradicted each other.
Where is the Ibex 35 bottom?
The most repeated question of the quarter was also the one no one answered correctly. One veteran insisted that the bottom was at 3,000 points, a figure he had defended for almost three years, and which sounded provocative in August 2011. Another analysis placed the correct bottom at 7,000 and warned that it would be broken, and "perhaps by a lot". A third introduced inflation into the equation and calculated that the inflation-adjusted historical low would be around 4,000.
In between, short-term levels piled up. 8,350 acted as a 95.44% volatility bellwether, and below it, they said, lay hell. 8,100 and 8,000 appeared as the next stops. 9,108 was defended as a support that kept the scenario "controlled," with room even down to 8,920-8,960 without breaking anything. So many figures together had one virtue and one flaw: all could be justified with a chart, and none served to anticipate Monday.
The tug-of-war between sellers and blue-chip buyers
With banks at rock bottom, the practical debate emerged: what to do with Santander and Telefónica. Some argued for waiting two consecutive days without declines before touching anything. Others maintained that buying around 6.80-7 euros per share of Santander wasn't a bad move, as long as the support held. A third party entered into a discussion about the basic arithmetic of averaging down: the average acquisition price is calculated by weighting prices by quantities —(p1×c1 + p2×c2)/(c1+c2)—, and there's a notable difference between averaging down when it works and pyramiding when it fails.
The conversation devolved into the usual: maintenance fees, the cut the tax authorities take if it goes well, and the nothing it contributes if it goes badly, and the recurring advice that with 700 euros, it might be better to buy physical metal and hide it in the toilet cistern. The response was swift: 700 euros wasn't even enough to start. Dry August humor.
Some confessed a drawdown of 15,000 euros to gain 1,000, and others, between diaper changes, dropped by to say hello on the day of the crash. Also, those who announced they were building a buy-and-hold portfolio with Santander at 3 euros, Telefónica at 11, and T.R.eunidas at 12, to be the envy of those who bought property in 2007.
When the model stops recognizing the market
One of the most cited warnings of the quarter came from within trading operations itself: neural approximators do not recognize the patterns currently in use, nor fractal algorithms, nor MRA analyses, which only showed noise. Translated: the system had been working for months and suddenly stopped knowing where the blows were coming from. The author makes a living from this and stated it plainly: anyone who wanted to preserve their capital should stay out of the market.
Another logged a textbook trade contrary to that prudence: shorts peine at the edge of 9,920-9,930 with European indices opening euphorically and an upward gap built in the final minutes before the bell. They described it as smelling like fake. They closed the gap at 9,840. Sixty points in fifteen minutes. Perhaps the best indicator that August wasn't any chart, but the word "fake" applied to a bullish opening.
Marc Faber and the omen that came from abroad
At the start of the quarter, Marc Faber's analysis circulated, raising his S&P 500 correction forecast from 10% to 16%. The data served as ammunition for some and noise for others, who recalled he had been warning for some time. The underlying discussion was different: whether the problem was in the United States or Europe. Subsequent events didn't resolve it; quite the contrary, as that same quarter Bank of America lost 20.32%.
Why couldn't anyone agree on the Ibex 35?
The most lucid discussion of the quarter wasn't about levels, but about nature. One side argued that the same discourse appears in all cyclical downturns: that this time it's different, that this time it's for real, that capitalism is ending. The other responded that the inflation-adjusted historical low allowed for talk of an unprecedented decline and that many people would suffer greatly. This isn't a nuance disagreement. It's a disagreement about the time frame being measured: those who look twenty years see a correction; those who look two, see a collapse.
A third, colder approach, simply noted the mechanism: when everyone is hysterical and prices are rock bottom, the conditions are ripe for significant counter-movements. It's the old cycle of antiestéticar and greed, written forty times in a row on a single line by someone who didn't feel like explaining it better.
With the Ibex losing over 5% in one session, Spanish bonds dropping six tenths in ten minutes, and the S&P 500 shedding 6.66%, the quarter ended without anyone having answered the only question that mattered. The 3,000 bottom had been on the table for three years. The 7,000 for a few months. 8,350 had been discussed with decimals. And that's where everything got stuck: the same chart could be used to argue that there was still 15% left to fall and that a rebound was about to begin.
Summary of a discussion on Burbuja.info - Foro de economía, actualidad y política., translated from Spanish and reviewed before publication. Read the full discussion (4607 replies).
More summaries
-
Ibex 35 June 2010: The Crash That Defined the Summer Stock Market
Ibex 35: -2.43% on June 1, 2010. Fitch cuts FROB and SEPI ratings to AA+. Spread with Bund widens to 1.70 points.
-
Ibex 35 January 2014: Banking Surges as Technical Analysis Targets 9,950
The Ibex 35 rose in January 2014 with banking stocks soaring, while Santander's non-performing loans in Spain reached 7.49% and technical analysis eyed the 9,950 level.
-
Gold stuck at 0.382 as bitcoin takes the spotlight
Gold stuck at 0.382 and unable to recover while bitcoin hits 6.000 dollars; thresholds at 1.250 and 1.050 set the scene.
-
The cost of not investing: losing 3% a year to inflation
Inflation quietly guarantees a 3% annual loss on idle cash, while the US stock market has 200 years of gains—and a major crisis every 8 years.
-
Extra virgin olive oil falls to €6.35 a litre at Mercadona
Extra virgin olive oil is now €6.35/litre at Mercadona, down from €6.75 months ago, while the origin price of picual is €4.143/kg
-
BIG offers 4% TAE on 6-month deposit with Spanish IBAN and Portuguese FGD
BIG launched a 4% TAE six-month and 3.5% three-month deposit in May 2023 with Spanish IBAN and Portuguese FGD, but later cut rates and had opening delays.