
Gold: From 32/gram bar to COMEX paper collapse
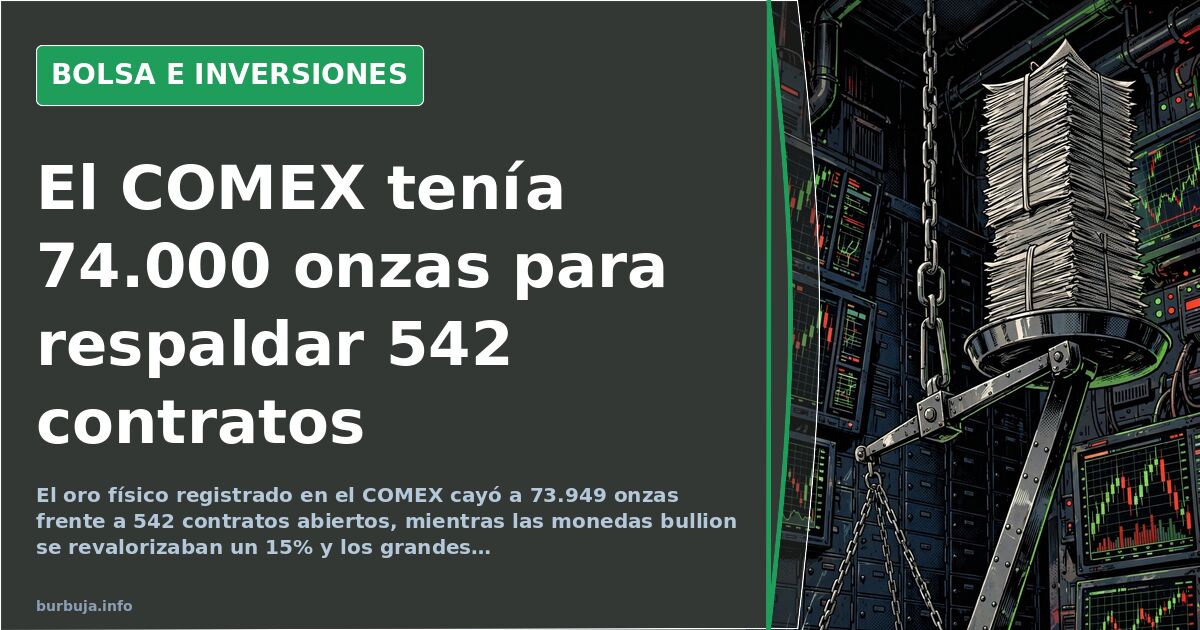
Physical gold registered on COMEX fell to 73,949 ounces against 542 open contracts, while bullion coins appreciated 15% and large...
English · Original discussion in Spanish · Published
Gold: Physical ounce disappears from COMEX as price plummets
At the end of July 2015, a participant jotted down three figures in their notebook: gold at 32.22 euros per gram, silver at 0.44, and the euro trading at 0.91 dollars. This served as a snapshot to start. A year later, hardly anyone was discussing the price. The debate had moved to the basement where the real metal is stored.
The issue that underpinned months of discussion was not whether gold was rising or falling, but how much paper was issued against each physical ounce that existed. The answer, according to the data that was posted, was chilling: the ratio of registered gold to open contracts went from 1 to 150 to 1 to 542. That's what remains when you stop looking at the quote and open the safe.
What exactly peine in the COMEX vaults
The sequence is simple to tell and difficult to digest. In a single day, three custodians — Brinks, HSBC, and Scotia — reclassified gold as eligible. The result: the total registered ounces fell to 73,949 troy ounces, just over two metric tons for a market that moves thousands of contracts daily.
The calculation that circulated at the time was damning: if the bank backing those positions has to deliver physical metal to all holders, it is bankrupt. And whoever formulated it stated it plainly: COMEX is broken, but there is no interest in it collapsing. The second half of the sentence matters more than the first. If it could be burst with relatively little money, someone would have done it. It didn't happen. That is also information.
In parallel, China stopped publishing data on metal withdrawals from its Shanghai market. A news blackout that was interpreted as what it probably was: stopping showing cards when the hand gets interesting.
Physical metal and paper: two different products with the same name
Here there was unusual consensus among profiles that rarely agree. The idea that was repeated: a mining stock, an ETF, or a gold future are not gold. They are derivatives that respond to market panic just like any other listed asset.
The comparison that best illustrated it was almost textbook: owning shares in a mining company is like owning the blueprints of a building under construction; owning the ounces is having the key to the apartment and living in it. In a financial crash, the blueprints become wet paper. The key, no.
Whoever buys physical metal, it was argued, is not speculating: they are withdrawing liquidity from a system that only generates distrust. It's a loaded phrase because it sounds like a rant but is actually a concrete financial thesis. Gold leaving the banking circuit is no longer available to leverage contracts. It's a withdrawal of chips from the casino, not a bet.
The crash prophecy: four years wrong about the date
One of the most repeated lines of argument was the archive of the great end-time announcers. James Rickards set the collapse of the monetary system for the fourth quarter of 2014. Gerald Celente predicted a global stock market crash before the end of 2015. Jim Sinclair had been warning of financial nuclear bombs for years prior.
The diagnosis that took hold: those who give exact dates and round figures always fail. Not for lack of information, but because they confuse structural analysis with a lottery ticket. Of course, a distinction was made between subscribing to the thesis and trinc those who move the market. The difference is significant, not rational.
No one with common sense believed a rise to $1,800 in May or a $200 gap in a single session. When someone suggested it, the response was polite but firm: if that happens, it means something very serious has peine in the world, and not exactly good.
Will gold fall below $1,000 with the Fed's rate hike?
This was the recurring question for newcomers. The majority answer nuanced two things. First: for those who buy one or two ounces a year, the entry price is almost irrelevant compared to the reason for the purchase. Second: the exchange rate works against price drops in euros even if the dollar makes the metal more expensive.
The complete exercise done at the time — crossing rate hikes, dollar strength, and euro-dollar parity — yielded an entry range very different from what the dollar headline suggested. That breakdown, item by item, is the kind that changes the mind of someone who only looks at the ounce chart.
From 26 to 30 euros: the revaluation almost no one watches
Outside the noise of naked metal, there was a corner where prices did rise with gusto: bullion coins. The 2013 Silver Panda, which before the summer was around 26 euros, started selling for close to 30 with no room for negotiation.
The analysis behind it was simple: a coin with a different design each year accumulates a numismatic component that a fixed-design coin does not have. Those who mock collectible coins miss the only segment of the market where scarcity translates into price without going through a derivative.
Practical advice also circulated: no buying large lots online, as the risk of being ripped off is very high. A German physical store, a fruta distributor, and not much else. The high premium on small silver — the smaller the piece, the more expensive the gram — was noted as a common trap for novices.
Oil, geopolitics, and background noise
The price of crude oil was the other major marker of the era. The barrel's fall was interpreted as a political decision, not a supply and demand accident: whoever can open and close the tap sets the price, and for a time deliberately kept it open.
From there, it jumped to geopolitics without transition: Syria, sanctions, the energy agreement between Russia and China signed just before the oil crash. Whoever signed it at the old price pays double the market price, and that is not forgotten. The thread of metal is, at its core, a thread about who controls which currency.
The indicator that proved the doomsayers right
Among the signals being trinc, one stood out for its technical precision: the downward cross of the 50-day moving average over the 200-day in the S&P. A classic requirement for a bear market. The last time something similar had occurred was between July and October 2011, and the market then recovered its trend by crossing the averages again.
On this occasion, both averages crossed with a negative slope, and no one bet a cent on a rebound. The question that remained unanswered was uncomfortable: if money seeks refuge in a bear market, why are gold mining stocks also plummeting? The answer given had a harsh logic: when panic tightens, you sell what's going up, and mining stocks had gone up a lot.
And here's the disorienting fact: while the end of paper money and the collapse of vaults were being discussed, gold was trading at $1,321 and silver was nearing $18.50. Neither the one nor the other. The metal held its breath, and all apocalyptic diagnoses expired on schedule.
At the end of July 2015, a participant jotted down three figures in their notebook: gold at 32.22 euros per gram, silver at 0.44, and the euro trading at 0.91 dollars. This served as a snapshot to start. A year later, hardly anyone was discussing the price. The debate had moved to the basement where the real metal is stored.
The issue that underpinned months of discussion was not whether gold was rising or falling, but how much paper was issued against each physical ounce that existed. The answer, according to the data that was posted, was chilling: the ratio of registered gold to open contracts went from 1 to 150 to 1 to 542. That's what remains when you stop looking at the quote and open the safe.
What exactly peine in the COMEX vaults
The sequence is simple to tell and difficult to digest. In a single day, three custodians — Brinks, HSBC, and Scotia — reclassified gold as eligible. The result: the total registered ounces fell to 73,949 troy ounces, just over two metric tons for a market that moves thousands of contracts daily.
The calculation that circulated at the time was damning: if the bank backing those positions has to deliver physical metal to all holders, it is bankrupt. And whoever formulated it stated it plainly: COMEX is broken, but there is no interest in it collapsing. The second half of the sentence matters more than the first. If it could be burst with relatively little money, someone would have done it. It didn't happen. That is also information.
In parallel, China stopped publishing data on metal withdrawals from its Shanghai market. A news blackout that was interpreted as what it probably was: stopping showing cards when the hand gets interesting.
Physical metal and paper: two different products with the same name
Here there was unusual consensus among profiles that rarely agree. The idea that was repeated: a mining stock, an ETF, or a gold future are not gold. They are derivatives that respond to market panic just like any other listed asset.
The comparison that best illustrated it was almost textbook: owning shares in a mining company is like owning the blueprints of a building under construction; owning the ounces is having the key to the apartment and living in it. In a financial crash, the blueprints become wet paper. The key, no.
Whoever buys physical metal, it was argued, is not speculating: they are withdrawing liquidity from a system that only generates distrust. It's a loaded phrase because it sounds like a rant but is actually a concrete financial thesis. Gold leaving the banking circuit is no longer available to leverage contracts. It's a withdrawal of chips from the casino, not a bet.
The crash prophecy: four years wrong about the date
One of the most repeated lines of argument was the archive of the great end-time announcers. James Rickards set the collapse of the monetary system for the fourth quarter of 2014. Gerald Celente predicted a global stock market crash before the end of 2015. Jim Sinclair had been warning of financial nuclear bombs for years prior.
The diagnosis that took hold: those who give exact dates and round figures always fail. Not for lack of information, but because they confuse structural analysis with a lottery ticket. Of course, a distinction was made between subscribing to the thesis and trinc those who move the market. The difference is significant, not rational.
No one with common sense believed a rise to $1,800 in May or a $200 gap in a single session. When someone suggested it, the response was polite but firm: if that happens, it means something very serious has peine in the world, and not exactly good.
Will gold fall below $1,000 with the Fed's rate hike?
This was the recurring question for newcomers. The majority answer nuanced two things. First: for those who buy one or two ounces a year, the entry price is almost irrelevant compared to the reason for the purchase. Second: the exchange rate works against price drops in euros even if the dollar makes the metal more expensive.
The complete exercise done at the time — crossing rate hikes, dollar strength, and euro-dollar parity — yielded an entry range very different from what the dollar headline suggested. That breakdown, item by item, is the kind that changes the mind of someone who only looks at the ounce chart.
From 26 to 30 euros: the revaluation almost no one watches
Outside the noise of naked metal, there was a corner where prices did rise with gusto: bullion coins. The 2013 Silver Panda, which before the summer was around 26 euros, started selling for close to 30 with no room for negotiation.
The analysis behind it was simple: a coin with a different design each year accumulates a numismatic component that a fixed-design coin does not have. Those who mock collectible coins miss the only segment of the market where scarcity translates into price without going through a derivative.
Practical advice also circulated: no buying large lots online, as the risk of being ripped off is very high. A German physical store, a fruta distributor, and not much else. The high premium on small silver — the smaller the piece, the more expensive the gram — was noted as a common trap for novices.
Oil, geopolitics, and background noise
The price of crude oil was the other major marker of the era. The barrel's fall was interpreted as a political decision, not a supply and demand accident: whoever can open and close the tap sets the price, and for a time deliberately kept it open.
From there, it jumped to geopolitics without transition: Syria, sanctions, the energy agreement between Russia and China signed just before the oil crash. Whoever signed it at the old price pays double the market price, and that is not forgotten. The thread of metal is, at its core, a thread about who controls which currency.
The indicator that proved the doomsayers right
Among the signals being trinc, one stood out for its technical precision: the downward cross of the 50-day moving average over the 200-day in the S&P. A classic requirement for a bear market. The last time something similar had occurred was between July and October 2011, and the market then recovered its trend by crossing the averages again.
On this occasion, both averages crossed with a negative slope, and no one bet a cent on a rebound. The question that remained unanswered was uncomfortable: if money seeks refuge in a bear market, why are gold mining stocks also plummeting? The answer given had a harsh logic: when panic tightens, you sell what's going up, and mining stocks had gone up a lot.
And here's the disorienting fact: while the end of paper money and the collapse of vaults were being discussed, gold was trading at $1,321 and silver was nearing $18.50. Neither the one nor the other. The metal held its breath, and all apocalyptic diagnoses expired on schedule.
Summary of a discussion on Burbuja.info - Foro de economía, actualidad y política., translated from Spanish and reviewed before publication. Read the full discussion (6090 replies).
More summaries
-
Gold Hits $4,000 After Doubling, Texas Accepts It as Currency
Gold jumps from $1,450 to $4,106 per ounce, correcting to $4,000, as Texas, Florida, and Missouri recognize it as legal tender.
-
Gold stuck at 0.382 as bitcoin takes the spotlight
Gold stuck at 0.382 and unable to recover while bitcoin hits 6.000 dollars; thresholds at 1.250 and 1.050 set the scene.
-
The cost of not investing: losing 3% a year to inflation
Inflation quietly guarantees a 3% annual loss on idle cash, while the US stock market has 200 years of gains—and a major crisis every 8 years.
-
Extra virgin olive oil falls to €6.35 a litre at Mercadona
Extra virgin olive oil is now €6.35/litre at Mercadona, down from €6.75 months ago, while the origin price of picual is €4.143/kg
-
BIG offers 4% TAE on 6-month deposit with Spanish IBAN and Portuguese FGD
BIG launched a 4% TAE six-month and 3.5% three-month deposit in May 2023 with Spanish IBAN and Portuguese FGD, but later cut rates and had opening delays.
-
Spot-price coins: the seller whose paper trail didn't add up
He offered quarter-ounce gold coins at spot price and racked up undelivered orders. Buyers cross-checked his details and several got their money back.