
Buy now or wait for crash: arithmetic dictates
Shiller CAPE at 31 and 3% unemployment don't predict a crash. Waiting costs real money via inflation and missed dividends.
English · Original discussion in Spanish · Published
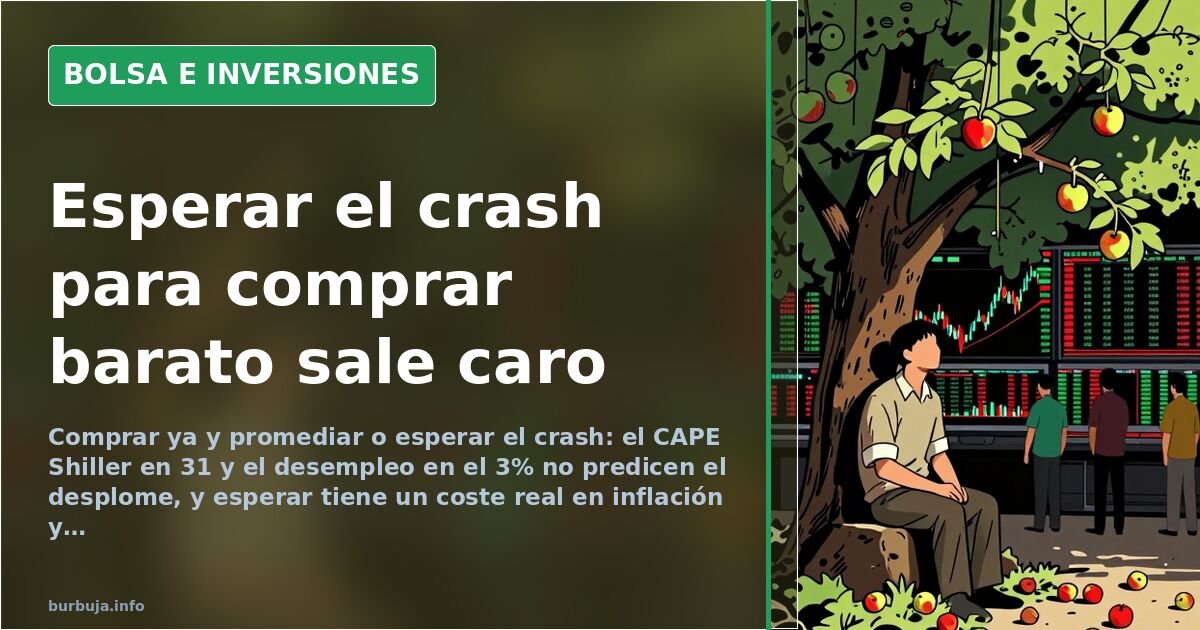
Buy stocks now or wait for the crash: what the math says
Waiting for the next market crash to buy quality stocks is, in most documented cases, a bad idea. Not due to ideology, but arithmetic: while cash sits idle, inflation erodes purchasing power, time passes, and uncollected dividends are lost forever. Some argue the opposite—hold liquidity and strike when markets plummet—and their point has merit: buying at highs hurts. The question is how much it hurts versus the cost of avoiding that pain.
At first glance, saving and waiting seems superior. In practice, it requires timing two things correctly: when the drop happens and how deep it goes. Someone waiting for a 50% index correction might see a 15% dip, a rebound, and further gains. They then realize their plan wasn't a strategy, but an bet with an undefined deadline.
Why does waiting for a crash cost so much?
The cost of staying out has three components invisible on charts: time, inflation, and missed dividends. Capital sitting idle for three years in low-yield accounts silently loses purchasing power. When the correction finally arrives, that same money buys fewer shares than it would have initially, because the bottom of the fall usually remains above the starting point of the wait.
In contrast, periodic contributions reduce the risk of entering at the absolute worst moment. It doesn't eliminate risk; it spreads it. This is the strongest argument for those who advocate buying now and adding monthly, relying not on oracles but on consistency.
What does evidence say about buying at all-time highs?
Any asset rising long-term spends much of its time at all-time highs. Being at highs alone means nothing. Nor do ten-year bull runs accumulate; history shows even longer ones. The data that matters is different: money left on the table by waiting for the big drop vastly exceeds losses incurred during the drop itself.
This calculation, broken down year by year with reinvested dividends, dismantles the waiting plan. Those who run it understand why indexing into broad markets and consistent contributions worked over any fifteen-year period, including those containing oil crises, dot-com busts, and housing bubbles.
Shiller CAPE at 31 and 3% unemployment: indicators that don't predict
The Shiller CAPE is at 31, well above historical averages, and the yield curve spread nears zero, often signaling recession though not always. Neither helps forecast stock performance one year ahead. Their predictive value under five years is nearly nil, with dispersion so wide that the S&P 500 could end twelve months later anywhere between 2000 and 4000 points.
Memory plays tricks. With the S&P 500 at 1200 points over a decade ago, doom-mongers predicted total collapse. It didn't happen. US unemployment around 3% today suggests the opposite: the cycle has room to run. Indicators cited to justify antiestéticar—the S&P 500/gold ratio, Buffett indicator, yield spread—only give vague ideas of whether markets are expensive or cheap.
When value drops 65% and diversification fails
One case deserves attention. In February 2007, investors trinc value gurus put money into the era's hot fund: impeccable track record, double-digit returns, no banks, having dodged the dot-com crisis. Within eighteen months, they lost 65%. Only persistence and time restored capital.
Analysis reveals two errors. First, concentration: a fund skewed to Spanish and European equities falls harder than a global one. Recovering from -50% vs -65% differs hugely, requiring doubling or tripling respectively. Second, believing sector diversification suffices: in that crash, banks, oil, real estate, and almost everything fell. Only gold and public bonds held up. A portfolio with 5% gold and 25% government debt would have absorbed the blow better.
MSCI World ETFs: accumulation, distribution, and fees
For those choosing global indexing, the choice between accumulating and distributing ETFs has tax consequences. Accumulating funds reinvest dividends internally, bypassing withholding tax, favoring participants long-term. The iShares Core MSCI World (IE00B4L5Y983), traded on Amsterdam and Xetra, works this way.
If preferring distributions, two classics exist: Lyxor MSCI World (FR0010315770) on Euronext Paris with 0.30% fee, and Xtrackers MSCI World (IE00BK1PV551) on Frankfurt with 0.19%. The latter looks cheaper on paper, but check fund documentation before deciding. Don't forget a overlooked detail: taxation acts like a purchase fee exceeding 10%.
100% Liquidity: the cost of being right too early
Those waiting for crashes often hold near-total liquidity. Cases exist of portfolios with 80-90% cash awaiting a major drop that, according to owners, "never comes." Meanwhile, money doesn't grow, and opportunities are bought at prices never seen again.
The counterargument is simple: cracks will happen, as they always have. But knowing it will occur isn't knowing when. Calling a crash five years early achieves nothing; it finances certainty with lost returns.
By 2019 and beyond, prices already looked attractive to those sidelined. The recurring warning stands: cold-blooded buying during collapses isn't improvised. It's trained by buying beforehand.
Waiting for the next market crash to buy quality stocks is, in most documented cases, a bad idea. Not due to ideology, but arithmetic: while cash sits idle, inflation erodes purchasing power, time passes, and uncollected dividends are lost forever. Some argue the opposite—hold liquidity and strike when markets plummet—and their point has merit: buying at highs hurts. The question is how much it hurts versus the cost of avoiding that pain.
At first glance, saving and waiting seems superior. In practice, it requires timing two things correctly: when the drop happens and how deep it goes. Someone waiting for a 50% index correction might see a 15% dip, a rebound, and further gains. They then realize their plan wasn't a strategy, but an bet with an undefined deadline.
Why does waiting for a crash cost so much?
The cost of staying out has three components invisible on charts: time, inflation, and missed dividends. Capital sitting idle for three years in low-yield accounts silently loses purchasing power. When the correction finally arrives, that same money buys fewer shares than it would have initially, because the bottom of the fall usually remains above the starting point of the wait.
In contrast, periodic contributions reduce the risk of entering at the absolute worst moment. It doesn't eliminate risk; it spreads it. This is the strongest argument for those who advocate buying now and adding monthly, relying not on oracles but on consistency.
What does evidence say about buying at all-time highs?
Any asset rising long-term spends much of its time at all-time highs. Being at highs alone means nothing. Nor do ten-year bull runs accumulate; history shows even longer ones. The data that matters is different: money left on the table by waiting for the big drop vastly exceeds losses incurred during the drop itself.
This calculation, broken down year by year with reinvested dividends, dismantles the waiting plan. Those who run it understand why indexing into broad markets and consistent contributions worked over any fifteen-year period, including those containing oil crises, dot-com busts, and housing bubbles.
Shiller CAPE at 31 and 3% unemployment: indicators that don't predict
The Shiller CAPE is at 31, well above historical averages, and the yield curve spread nears zero, often signaling recession though not always. Neither helps forecast stock performance one year ahead. Their predictive value under five years is nearly nil, with dispersion so wide that the S&P 500 could end twelve months later anywhere between 2000 and 4000 points.
Memory plays tricks. With the S&P 500 at 1200 points over a decade ago, doom-mongers predicted total collapse. It didn't happen. US unemployment around 3% today suggests the opposite: the cycle has room to run. Indicators cited to justify antiestéticar—the S&P 500/gold ratio, Buffett indicator, yield spread—only give vague ideas of whether markets are expensive or cheap.
When value drops 65% and diversification fails
One case deserves attention. In February 2007, investors trinc value gurus put money into the era's hot fund: impeccable track record, double-digit returns, no banks, having dodged the dot-com crisis. Within eighteen months, they lost 65%. Only persistence and time restored capital.
Analysis reveals two errors. First, concentration: a fund skewed to Spanish and European equities falls harder than a global one. Recovering from -50% vs -65% differs hugely, requiring doubling or tripling respectively. Second, believing sector diversification suffices: in that crash, banks, oil, real estate, and almost everything fell. Only gold and public bonds held up. A portfolio with 5% gold and 25% government debt would have absorbed the blow better.
MSCI World ETFs: accumulation, distribution, and fees
For those choosing global indexing, the choice between accumulating and distributing ETFs has tax consequences. Accumulating funds reinvest dividends internally, bypassing withholding tax, favoring participants long-term. The iShares Core MSCI World (IE00B4L5Y983), traded on Amsterdam and Xetra, works this way.
If preferring distributions, two classics exist: Lyxor MSCI World (FR0010315770) on Euronext Paris with 0.30% fee, and Xtrackers MSCI World (IE00BK1PV551) on Frankfurt with 0.19%. The latter looks cheaper on paper, but check fund documentation before deciding. Don't forget a overlooked detail: taxation acts like a purchase fee exceeding 10%.
100% Liquidity: the cost of being right too early
Those waiting for crashes often hold near-total liquidity. Cases exist of portfolios with 80-90% cash awaiting a major drop that, according to owners, "never comes." Meanwhile, money doesn't grow, and opportunities are bought at prices never seen again.
The counterargument is simple: cracks will happen, as they always have. But knowing it will occur isn't knowing when. Calling a crash five years early achieves nothing; it finances certainty with lost returns.
By 2019 and beyond, prices already looked attractive to those sidelined. The recurring warning stands: cold-blooded buying during collapses isn't improvised. It's trained by buying beforehand.
Also available in: Deutsch
Summary of a discussion on Burbuja.info - Foro de economía, actualidad y política., translated from Spanish and reviewed before publication. Read the full discussion (110 replies).
More summaries
-
Spanish retail investors buy dip in Nvidia, PayPal and Novo Nordisk
Spanish individual investors buy Nvidia at €108, PayPal and Novo Nordisk at €40 amid market drops. Full list and risks of averaging down.
-
Dividend Investing: Faith, Taxes, and the 2027 Crash
Vici pays €0.38 and HP €0.25 per share, but the tax authority takes 19%. The dividend-living strategy has already dated the next crash: 2027.
-
Forum User Spots HCH Pattern in Gold, Targets $4,000
Gold hovering near $4,300. One participant identifies an HCH pattern targeting $4,000, sparking debate over whether to wait for a correction or buy into the dip.
-
Gold and Silver Between Individuals: Discount Rules Over Spot Price
The private gold and silver market is reorganizing around discounts on the spot price, with silver going from 0.434 euros per gram to 74 euros per ounce.
-
Father borrows €30,000 at son's birth to invest for 25 years
A father plans to borrow €30,000 when his son is born to invest it for 25 years, aiming for €350,000. Forum users question the projected returns.
-
Swiss ZKB: AAA rating, €100k minimum, 0.05% yield
Swiss bank ZKB requires a €100,000 minimum for its AAA-rated accounts, offering just 0.05% interest as savers prioritize security over returns.