
Gold Drops and Recovers: Savers Hold Firm Without Selling
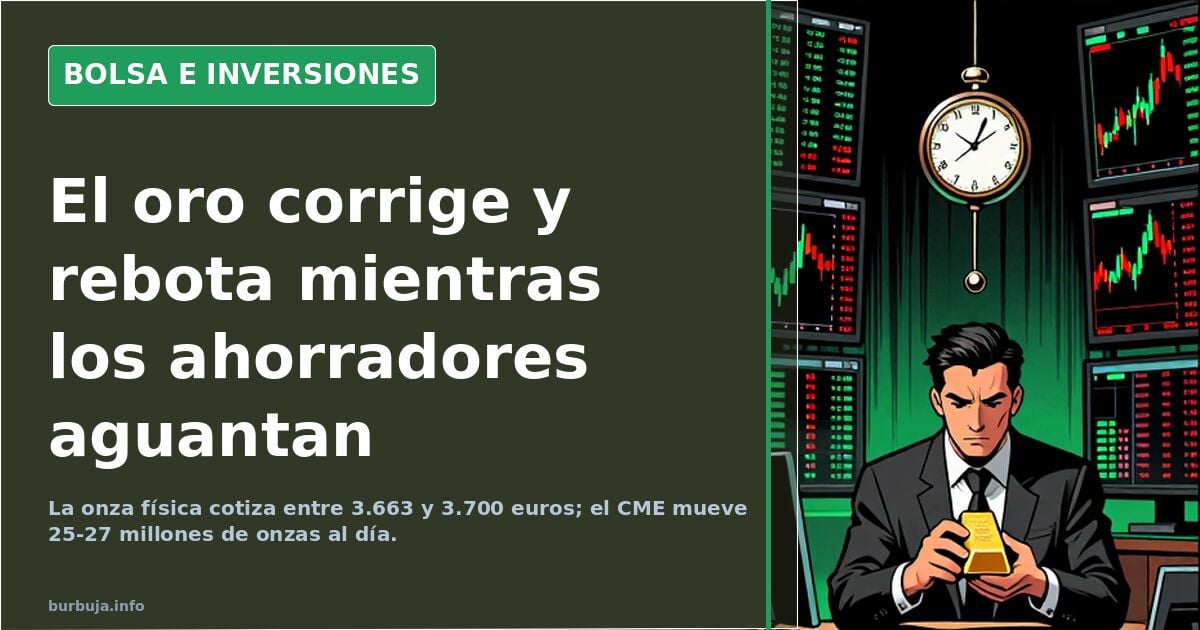
Gold corrects and rebounds as forum users hold their ground. Physical ounces trade between €3,663 and €3,700; CME moves 25-27 million ounces daily.
English · Original discussion in Spanish · Published
Gold Corrects and Rises Again as Savers Hold On
The crash lasted less time than the scare. The price of gold and silver saw a correction that, according to an ironic tweet cited in the thread, erased 5% in a single session, enough to shift the conversation from optimism to "what a blow" in a matter of hours. Shortly after, the metal was trading upwards again, and the drop became an anecdote: in European dealers, physical ounces traded between €3,663 and €3,700. The panic narrative dissolved as quickly as it had formed.
How Much Gold Fell and How Long the Panic Lasted
The correction wasn't long, but it was ugly. The first messages describe a day of brutal shock, with drops that one participant estimated at 300 points, leaving more than one saver staring at the screen, unsure whether to touch anything. The majority response was the opposite of instinct: hold on. "It stings, that's for sure," summarized one participant, who favored using the discount to increase their position.
The most repeated explanation for the plunge had nothing to do with the metal itself. It's argued that the drop is forced from the derivatives market, where paper is pulled to drive the price down and buy back lower. "They drop it 300 to catch it and bring it back to normal," added another, convinced that with the current inflation, the strange thing is that the ounce isn't even higher.
And then there was the calendar argument. Some argue that those who sell futures without backing today will have to answer when they expire, and that by then they'll be printing money: more dollars in circulation, more pressure on the currency, more gold. Bread today, hunger tomorrow.
CME Futures and Physical Demand: The Numbers That Clash
This is where the analysis gets interesting, as the available data allows for a comparison of the two markets. Annual demand for physical gold for investment was 1,186 tons in 2024, according to the World Gold Council. At 2025 prices, around $4,300 per ounce, that equates to about $164 billion annually, or approximately $450 million daily. A respectable figure. A tiny figure compared to the other.
The daily volume of the "paper" market—over-the-counter derivatives, futures, and ETFs combined—is around $200 billion to $300 billion. Gold futures alone on the CME trade between 25 and 27 million ounces daily, over $110 billion. In other words: what is traded in contracts that replicate the metal multiplies by hundreds what is actually delivered. The manipulation thesis supported by several participants is built on this imbalance.
Why Compare Physical Gold with ETFs and CFDs?
Because they are not the same, even if they trade similarly. Physical gold involves the actual delivery of bars and coins. "Paper" only replicates the price of the underlying asset. Those who defend the metal long-term insist on this distinction with a practical argument: in a real crisis, financial instruments claiming to be equivalent to gold will have high premiums in stores and supply problems, while the ounce in hand needs no counterparty.
The other half of the argument is historical. Some currencies disappeared—the peseta, the mark, the reichsmark—and with them, the savings of those who held cash. Hence the repeated idea: gold is not an investment or a refuge, it is money. A vehicle to transfer savings from one era to another.
Price of the Ounce: Between €3,663 and €3,700 Depending on the Dealer
For those who buy and don't speculate, the drop translated into concrete numbers. The ounce in European dealers traded in a narrow range: the krugerrand at €3,663 in Belgium, the cheapest found, and €3,670 at Auragentum, compared to €3,700 seen at other shops. Differences of tens of euros that matter for recurring purchases, leading to half the conversation sharing updated price comparison tools.
The underlying complaint wasn't the price, but the estimulante ilegal. One saver summarized the discouragement: from being able to buy an ounce with a month's net salary to not being able to buy even half. The correction didn't even last two weeks, and there the script of those expecting a long buying window was broken.
Inflation, the Dollar, and the Tug-of-War Between Blocs
The last part of the analysis moves into the geopolitical arena. It's argued that the United States is pushing the price of its own bonds while trying to contain the price of competing assets, and that the metal's movement is better understood as monetary warfare than a thermometer of demand. In this context, the key lies in Asian markets: if they buy the discount wholesale, the correction will run its course on its own.
The other current, more pragmatic, warns of the opposite. If gold rises much faster than inflation, it's because the market anticipates higher inflation than current, and that bill will arrive. The response from those who have been in for years is that the metal has risen so much that it already discounts that scenario, and that if inflation skyrockets in 2026, gold will respond even faster.
The disagreement remains alive at the exact point where data falls short: no one has managed to measure how much of the rise is real physical demand and how much is leveraged financial position. With that gap open, the ounce will continue to rise and fall without anyone signing off on the explanation.
This article does not constitute financial advice. The data cited comes from public debate and the figures presented within it.
The crash lasted less time than the scare. The price of gold and silver saw a correction that, according to an ironic tweet cited in the thread, erased 5% in a single session, enough to shift the conversation from optimism to "what a blow" in a matter of hours. Shortly after, the metal was trading upwards again, and the drop became an anecdote: in European dealers, physical ounces traded between €3,663 and €3,700. The panic narrative dissolved as quickly as it had formed.
How Much Gold Fell and How Long the Panic Lasted
The correction wasn't long, but it was ugly. The first messages describe a day of brutal shock, with drops that one participant estimated at 300 points, leaving more than one saver staring at the screen, unsure whether to touch anything. The majority response was the opposite of instinct: hold on. "It stings, that's for sure," summarized one participant, who favored using the discount to increase their position.
The most repeated explanation for the plunge had nothing to do with the metal itself. It's argued that the drop is forced from the derivatives market, where paper is pulled to drive the price down and buy back lower. "They drop it 300 to catch it and bring it back to normal," added another, convinced that with the current inflation, the strange thing is that the ounce isn't even higher.
And then there was the calendar argument. Some argue that those who sell futures without backing today will have to answer when they expire, and that by then they'll be printing money: more dollars in circulation, more pressure on the currency, more gold. Bread today, hunger tomorrow.
CME Futures and Physical Demand: The Numbers That Clash
This is where the analysis gets interesting, as the available data allows for a comparison of the two markets. Annual demand for physical gold for investment was 1,186 tons in 2024, according to the World Gold Council. At 2025 prices, around $4,300 per ounce, that equates to about $164 billion annually, or approximately $450 million daily. A respectable figure. A tiny figure compared to the other.
The daily volume of the "paper" market—over-the-counter derivatives, futures, and ETFs combined—is around $200 billion to $300 billion. Gold futures alone on the CME trade between 25 and 27 million ounces daily, over $110 billion. In other words: what is traded in contracts that replicate the metal multiplies by hundreds what is actually delivered. The manipulation thesis supported by several participants is built on this imbalance.
Why Compare Physical Gold with ETFs and CFDs?
Because they are not the same, even if they trade similarly. Physical gold involves the actual delivery of bars and coins. "Paper" only replicates the price of the underlying asset. Those who defend the metal long-term insist on this distinction with a practical argument: in a real crisis, financial instruments claiming to be equivalent to gold will have high premiums in stores and supply problems, while the ounce in hand needs no counterparty.
The other half of the argument is historical. Some currencies disappeared—the peseta, the mark, the reichsmark—and with them, the savings of those who held cash. Hence the repeated idea: gold is not an investment or a refuge, it is money. A vehicle to transfer savings from one era to another.
Price of the Ounce: Between €3,663 and €3,700 Depending on the Dealer
For those who buy and don't speculate, the drop translated into concrete numbers. The ounce in European dealers traded in a narrow range: the krugerrand at €3,663 in Belgium, the cheapest found, and €3,670 at Auragentum, compared to €3,700 seen at other shops. Differences of tens of euros that matter for recurring purchases, leading to half the conversation sharing updated price comparison tools.
The underlying complaint wasn't the price, but the estimulante ilegal. One saver summarized the discouragement: from being able to buy an ounce with a month's net salary to not being able to buy even half. The correction didn't even last two weeks, and there the script of those expecting a long buying window was broken.
Inflation, the Dollar, and the Tug-of-War Between Blocs
The last part of the analysis moves into the geopolitical arena. It's argued that the United States is pushing the price of its own bonds while trying to contain the price of competing assets, and that the metal's movement is better understood as monetary warfare than a thermometer of demand. In this context, the key lies in Asian markets: if they buy the discount wholesale, the correction will run its course on its own.
The other current, more pragmatic, warns of the opposite. If gold rises much faster than inflation, it's because the market anticipates higher inflation than current, and that bill will arrive. The response from those who have been in for years is that the metal has risen so much that it already discounts that scenario, and that if inflation skyrockets in 2026, gold will respond even faster.
The disagreement remains alive at the exact point where data falls short: no one has managed to measure how much of the rise is real physical demand and how much is leveraged financial position. With that gap open, the ounce will continue to rise and fall without anyone signing off on the explanation.
This article does not constitute financial advice. The data cited comes from public debate and the figures presented within it.
Summary of a discussion on Burbuja.info - Foro de economía, actualidad y política., translated from Spanish and reviewed before publication. Read the full discussion (215 replies).
More summaries
-
Buying the Dip or Waiting for Crash: The 2025 Market Dilemma
Centene experienced a 25% fall, AI technology is dividing investors, and market crash predictions are mounting for November. The 2025 investment dilemma: buy now or wait?
-
Gold stuck at 0.382 as bitcoin takes the spotlight
Gold stuck at 0.382 and unable to recover while bitcoin hits 6.000 dollars; thresholds at 1.250 and 1.050 set the scene.
-
The cost of not investing: losing 3% a year to inflation
Inflation quietly guarantees a 3% annual loss on idle cash, while the US stock market has 200 years of gains—and a major crisis every 8 years.
-
Extra virgin olive oil falls to €6.35 a litre at Mercadona
Extra virgin olive oil is now €6.35/litre at Mercadona, down from €6.75 months ago, while the origin price of picual is €4.143/kg
-
BIG offers 4% TAE on 6-month deposit with Spanish IBAN and Portuguese FGD
BIG launched a 4% TAE six-month and 3.5% three-month deposit in May 2023 with Spanish IBAN and Portuguese FGD, but later cut rates and had opening delays.
-
Spot-price coins: the seller whose paper trail didn't add up
He offered quarter-ounce gold coins at spot price and racked up undelivered orders. Buyers cross-checked his details and several got their money back.