
Climate 'Scam' and Historical Floods: The DANA Debate
The comparison between Valencia's 1957 flood, the 1879 storm, and the recent DANA reopens the debate on CO2's role in extreme weather.
English · Original discussion in Spanish · Published
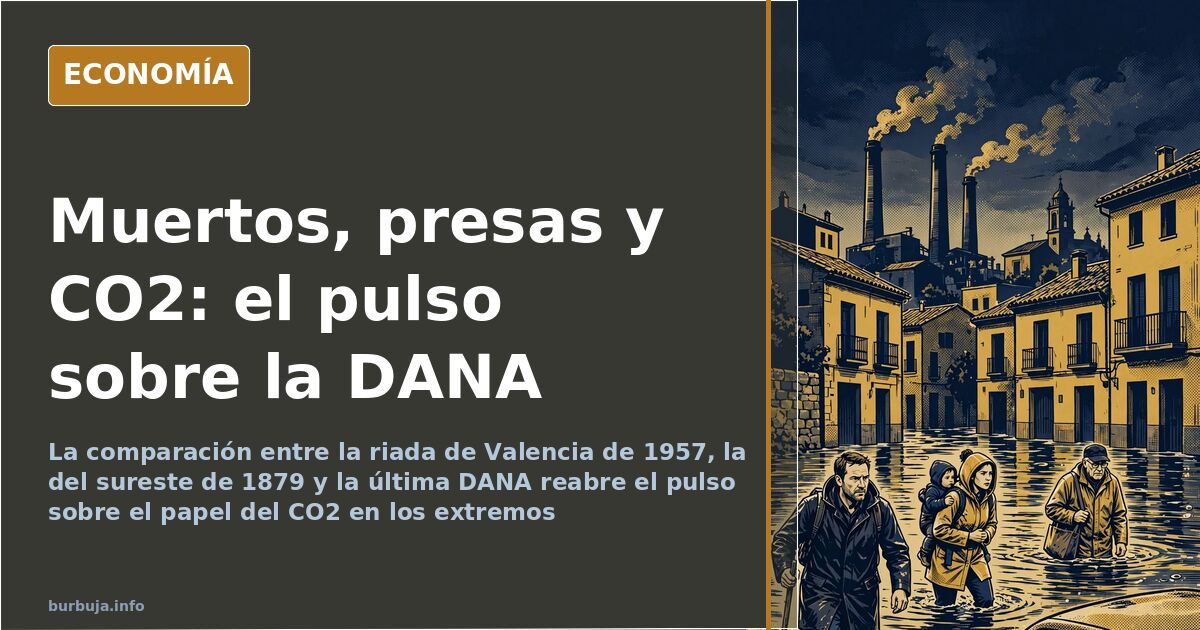
The DANA reopens the gap between climate and historical disasters
Have CO2 emissions caused the death, or did an uncleaned riverbed? The Valencia catastrophe — with a death toll in the discussion reaching 200 — has peine the debate between those who see climate change as an aggravating factor and those who dismiss it as a 'climate scam' built on a phenomenon as old as the cold drop. The numbers that cross paths are centuries old: the great Valencia flood of 1957, the one in the southeast in 1879, the Guadiana flood in Badajoz in 1997. None needed an industry like the current one to leave dead, houses torn away, and channels clogged with branches.
Why is the DANA compared to the Valencia flood of 1957?
Because it is the mandatory reference. The official record of the great Turia flood, on October 14, 1957, speaks of 81 dead. Other versions appearing in the conversation raise the figure far above: some mention 300 and others maintain that real estimates range from 3,000 to 5,000 victims, many of them in shacks erected within the channel, with bodies that would have been administratively buried as 'unidentified cadavers.' The dictatorship, it is argued, covered up the real extent.
The exercise goes beyond the count. 'With double the population and ten times more buildings in flood-prone areas, in a flood similar to that of '57, 5,000 would have died,' states an intervention. The thesis is uncomfortable and distinguishes no sides: mortality depends not only on how much water falls, but on how many people live exactly where the water will pass.
What do the historical series of extreme rain say?
That raining, it has always rained. The Santa Teresa flood, in the 19th century, submerged Murcia and Orihuela with water rising more than 10 meters and more than 1,000 dead, according to the chronicles cited. In the southeast, in October 1879, it is estimated that up to 600 millimeters fell in one hour in areas of the Vélez river, abruptly ending a four-year drought. And the Yangtze floods, with more than a million dead, function as the extreme reminder that natural disaster was not born with CO2.
From there comes the most repeated argument: the entire period with written records fits without crowding into the box of any graph of extreme events. The data window would, in this reading, be too short to conclude anything about trends.
Is there an increase in the intensity and frequency of extreme rains?
Here any consensus breaks. One part defends that total annual rainfall barely changes, but that events concentrate: the same falls in less time. The graph being handled has a red line above 70 millimeters and a frequency of peaks that, according to this reading, has soared in the last decade. A study by AEMET of 2021 and another published in Nature in 2018 are cited as support.
Weighing against is the long series. Those who consult it claim that the red line is at the same level as that of the 70s and that the last decade has nothing special, with the harshest decades of intense rain situated between 1955 and 1975. Records of daily maximum rainfall from Italy, the UK, and Germany are also provided to support that the increase does not appear anywhere. Two readings of the same lines. The disagreement is not about data, but about what is counted and from when.
Did they fail to clean channels, maintain dams, or warn in time?
It is the other front, and probably the one that bothers most. It is argued that much of the hydraulic infrastructure — retention dams, channeling, cleaning of torrential streams — was built precisely for this and that its abandonment transfers the problem from the sky to the mountains. Some describe the channel receiving 'thousands of tons of branches, reeds, and trees' and others respond that an infrastructure from seventy years ago worked perfectly.
The management flank adds reproaches. The suppression of the emergency unit created to coordinate this type of crisis is, in this conversation, the central reproach, attributed to a political decision by the regional administration. It is added that, with a red alert, the roads through which aid would later have to enter were not closed.
And what if it were the sun?
The cyclic hypothesis does not disappear. It points to a drop in sunspot activity that would advance a 'miniglaciation' towards 2030, with the argument that the scientific community already predicted similar episodes for the 17th-19th centuries. On the other side, an answer is given with a US academy report from the 70s that anticipated exactly the opposite: warming and its consequences, measurement by measurement.
A 1995 prediction is also rescued according to which the Atlantic would swallow Holland by 2008. That the Netherlands remain where they were is, for this part, proof that the story exaggerates.
With two centuries of floods, three different figures for the same October 1957, and a 70s report that already warned, the problem was never the lack of information. It was the lack of desire to look at it.
Have CO2 emissions caused the death, or did an uncleaned riverbed? The Valencia catastrophe — with a death toll in the discussion reaching 200 — has peine the debate between those who see climate change as an aggravating factor and those who dismiss it as a 'climate scam' built on a phenomenon as old as the cold drop. The numbers that cross paths are centuries old: the great Valencia flood of 1957, the one in the southeast in 1879, the Guadiana flood in Badajoz in 1997. None needed an industry like the current one to leave dead, houses torn away, and channels clogged with branches.
Why is the DANA compared to the Valencia flood of 1957?
Because it is the mandatory reference. The official record of the great Turia flood, on October 14, 1957, speaks of 81 dead. Other versions appearing in the conversation raise the figure far above: some mention 300 and others maintain that real estimates range from 3,000 to 5,000 victims, many of them in shacks erected within the channel, with bodies that would have been administratively buried as 'unidentified cadavers.' The dictatorship, it is argued, covered up the real extent.
The exercise goes beyond the count. 'With double the population and ten times more buildings in flood-prone areas, in a flood similar to that of '57, 5,000 would have died,' states an intervention. The thesis is uncomfortable and distinguishes no sides: mortality depends not only on how much water falls, but on how many people live exactly where the water will pass.
What do the historical series of extreme rain say?
That raining, it has always rained. The Santa Teresa flood, in the 19th century, submerged Murcia and Orihuela with water rising more than 10 meters and more than 1,000 dead, according to the chronicles cited. In the southeast, in October 1879, it is estimated that up to 600 millimeters fell in one hour in areas of the Vélez river, abruptly ending a four-year drought. And the Yangtze floods, with more than a million dead, function as the extreme reminder that natural disaster was not born with CO2.
From there comes the most repeated argument: the entire period with written records fits without crowding into the box of any graph of extreme events. The data window would, in this reading, be too short to conclude anything about trends.
Is there an increase in the intensity and frequency of extreme rains?
Here any consensus breaks. One part defends that total annual rainfall barely changes, but that events concentrate: the same falls in less time. The graph being handled has a red line above 70 millimeters and a frequency of peaks that, according to this reading, has soared in the last decade. A study by AEMET of 2021 and another published in Nature in 2018 are cited as support.
Weighing against is the long series. Those who consult it claim that the red line is at the same level as that of the 70s and that the last decade has nothing special, with the harshest decades of intense rain situated between 1955 and 1975. Records of daily maximum rainfall from Italy, the UK, and Germany are also provided to support that the increase does not appear anywhere. Two readings of the same lines. The disagreement is not about data, but about what is counted and from when.
Did they fail to clean channels, maintain dams, or warn in time?
It is the other front, and probably the one that bothers most. It is argued that much of the hydraulic infrastructure — retention dams, channeling, cleaning of torrential streams — was built precisely for this and that its abandonment transfers the problem from the sky to the mountains. Some describe the channel receiving 'thousands of tons of branches, reeds, and trees' and others respond that an infrastructure from seventy years ago worked perfectly.
The management flank adds reproaches. The suppression of the emergency unit created to coordinate this type of crisis is, in this conversation, the central reproach, attributed to a political decision by the regional administration. It is added that, with a red alert, the roads through which aid would later have to enter were not closed.
And what if it were the sun?
The cyclic hypothesis does not disappear. It points to a drop in sunspot activity that would advance a 'miniglaciation' towards 2030, with the argument that the scientific community already predicted similar episodes for the 17th-19th centuries. On the other side, an answer is given with a US academy report from the 70s that anticipated exactly the opposite: warming and its consequences, measurement by measurement.
A 1995 prediction is also rescued according to which the Atlantic would swallow Holland by 2008. That the Netherlands remain where they were is, for this part, proof that the story exaggerates.
With two centuries of floods, three different figures for the same October 1957, and a 70s report that already warned, the problem was never the lack of information. It was the lack of desire to look at it.
Also available in: Deutsch
Summary of a discussion on Burbuja.info - Foro de economía, actualidad y política., translated from Spanish and reviewed before publication. Read the full discussion (209 replies).
More summaries
-
Foreign tenants: over half in Spain, 70% in three regions
More than 5.2 million tenants in Spain were born abroad. In Madrid, Valencia and Murcia the share reaches 70%. Data and analysis of...
-
Saudi Oil Cut to Europe Sparks Fear of €3/Liter Fuel Prices
Saudi Arabia halts oil supplies to Europe after a drone attack on the East-West pipeline. Barrel prices surge, raising fears of €3 per liter fuel costs.
-
Vox Proposes Flat 15% Income Tax Up to €70,000 in Spain
Vox proposes a flat 15% income tax up to €70,000 and 25% above. Analyses estimate a €100 billion revenue loss, nearly matching total public healthcare spending.
-
Ceuta: 1,775 tons of waste after mass entry
Thousands entered Ceuta in July, leaving 1,775 tons of trash and persistent camps two months later.
-
Ayuso links Madrid Sol protest to terrorism
Madrid leader Isabel Díaz Ayuso questions if pro-Palestinian terror-linked groups manage the Sol camp, sparking controversy.
-
Saudi Arabia’s 2km Tower: Can People Live at One Kilometer?
Jeddah Tower shrinks to 1,000m while Riyadh plans a 2km tower. Experts debate the reality of living at such extreme heights.