El IPCC reconoce un "error" en su previsión del deshielo de los glaciares del Himalay

Nomeacuerdo

Madmaxista
Desde
29 Mar 2009
Mensajes
109
Reputación
33
Causes of global warming

Climatologists (scientists who study climate) have analyzed the global warming that has occurred since the late 1800's. A majority of climatologists have concluded that human activities are responsible for most of the warming. Human activities contribute to global warming by enhancing Earth's natural greenhouse effect. The greenhouse effect warms Earth's surface through a complex process involving sunlight, gases, and particles in the atmosphere. Gases that trap heat in the atmosphere are known as greenhouse gases.


Para los que no sepan nada de inglés, según la NASA, una mayoría de climatologos están de acuerdo en que las actividades del hombre son la causa de la mayor parte del calentamiento que está sufriendo la tierra desde los últimos años 1800.


NASA - Global Warming
 

Nar--

Madmaxista
Desde
20 May 2009
Mensajes
3.372
Reputación
4.487
Te repites te vuelvo a decir lo mismo.

Y si la nasa dice que para mitigar el calentamiento global, hay que inyectar azufre a la atmosfera, crear una nube permanente que simule gigantescas erupciones volcanicas para tapar el sol y reflejar sus rayos al espacio, que ha demostrado enfriar el planeta, que opinarias?

http://svcp.jpl.nasa.gov/meetings/2008/es/042201/PJR_JPL_april2008.ppt

Del premio Nobel P. J. CRUTZEN
http://www.cogci.dk/news/Crutzen_albedo enhancement_sulfur injections.pdf

Solar shield on agenda at climate summit - Telegraph

Solar shield on agenda at climate summit
Emergency measures to slow global warming, such as a ‘solar shield’ to block the sun or artificial trees to soak up CO2, will be discussed at a ‘geo-engineering’ conference.

Environmental scientist David Keith proposes a cheap, effective, shocking means to address climate change: What if we injected a huge cloud of ash into the atmosphere to deflect sunlight and heat?
Y si inyectamos una gigante nube en la atmófera para reflejar los rayos solares?

<!--copy and paste--><object width="446" height="326"><param name="movie" value="http://video.ted.com/assets/player/swf/EmbedPlayer.swf"></param><param name="allowFullScreen" value="true" /><param name="wmode" value="transparent"></param><param name="bgColor" value="#ffffff"></param> <param name="flashvars" value="vu=http://video.ted.com/talks/dynamic/DavidKeith_2007S-medium.flv&su=http://images.ted.com/images/ted/tedindex/embed-posters/DavidKeith-2007S.embed_thumbnail.jpg&vw=432&vh=240&ap=0&ti=192&introDuration=16500&adDuration=4000&postAdDuration=2000&adKeys=talk=david_keith_s_surprising_ideas_on_climate_change;year=2007;theme=bold_predictions_stern_warnings;theme=unconventional_explanations;theme=inspired_by_nature;event=TEDSalon+2007+Hot+Science;&preAdTag=tconf.ted/embed;tile=1;sz=512x288;" /><embed src="http://video.ted.com/assets/player/swf/EmbedPlayer.swf" pluginspace="http://www.macromedia.com/go/getflashplayer" type="application/x-shockwave-flash" wmode="transparent" bgColor="#ffffff" width="446" height="326" allowFullScreen="true" flashvars="vu=http://video.ted.com/talks/dynamic/DavidKeith_2007S-medium.flv&su=http://images.ted.com/images/ted/tedindex/embed-posters/DavidKeith-2007S.embed_thumbnail.jpg&vw=432&vh=240&ap=0&ti=192&introDuration=16500&adDuration=4000&postAdDuration=2000&adKeys=talk=david_keith_s_surprising_ideas_on_climate_change;year=2007;theme=bold_predictions_stern_warnings;theme=unconventional_explanations;theme=inspired_by_nature;event=TEDSalon+2007+Hot+Science;"></embed></object>

David Keith's unusual climate change idea | Video on TED.com

Programa redes, 01:05
<object width="425" height="344"><param name="movie" value="http://www.youtube.com/v/nV9o9Ycq22c&hl=es_ES&fs=1&"></param><param name="allowFullScreen" value="true"></param><param name="allow******access" value="always"></param><embed src="http://www.youtube.com/v/nV9o9Ycq22c&hl=es_ES&fs=1&" type="application/x-shockwave-flash" allow******access="always" allowfullscreen="true" width="425" height="344"></embed></object>
 

Nomeacuerdo

Madmaxista
Desde
29 Mar 2009
Mensajes
109
Reputación
33
No tengo claro para que vuelves a poner eso sobre las inyecciones de azufre a la atmosfera, pero lo único que aporta al tema es que SI que se está produciendo un calentamiento y que surgen posibles maniobras. Supongo que sabrás que hace tiempo que la tecnología puede influir en el clima.
 

Nar--

Madmaxista
Desde
20 May 2009
Mensajes
3.372
Reputación
4.487
Se ve que te saltaste la lección en el cole, sobre que el sol es fuente de vida, sin su luz y calor la vida no sería posible.

Pero si la mafia calentóloga, te dicen que hay calentamiento ni lo cuestionas, a pesar que se empieza a dilucidar es un fraude más, si te dicen que para salvarte del calentamiento, hay que tapar el sol, pues lo aceptarias tb, osea la oveja clásica, el prototipo de ciudadano crédulo y oficialista, al que no importaría le tapasen la luz del sol, y llenasen los pulmones de sus hijos de azufre, por el bien y la salvación terraquea, previo pago de tasas.

Repetir de nuevo que a lo largo de la historia de la tierra ha habido calentamientos anteriores y superiores tb, que obviamente no fueron provocados por el hombre, y que en esta época, de supuesto avance científico, se vuelve al antropocentismo por interes ecónomicos, mientras no se ataja el problema de la degradación ambiental, por la acción humana real, deforestación, desertización, contaminación, residuos de todo tipode industrias contaminantes, químicas, pesticidas, herbicidas, detergentes, etc

Aquí no habría debate, es un problema real, pero dificilmente se le pueden aplicar tasas a los ciudadanos por la contaminación de las industrias.
 
Última edición:

Nomeacuerdo

Madmaxista
Desde
29 Mar 2009
Mensajes
109
Reputación
33
Cuando te des cuenta que no todo lo que a ti se te ocurra que es una mentira mas lo es, entonces, estarás capacitado para hablar de un tema serio como este.

Si sabes leer, verás que yo no afirmo que el lo del calor sea tal ni que sea producido por el hombre, porque entiendo que hay diferencia de opiniones, pero según la mayoría de los que saben, o sea los científicos, los cuales muchas veces no son escuchados hasta el último momento por los políticos, si que es así. Y tambien tengo claro que los mayores interesados en ridiculizar este tema son las grandes multinacionales y que es algo muy serio que si se nos va de las manos puede ser fatal.

Y no digas mas tonterías que en lo que has puesto no dice nada de hacer que no llegue la luz del sol al planeta tierra. Lo que hay que leer.
 

Nomeacuerdo

Madmaxista
Desde
29 Mar 2009
Mensajes
109
Reputación
33
Veo que has editado:

Todos los que defienden la teoría del calentamiento por causa del hombre saben, y admiten, que en la tierra ha habido otros tiempos con otras temperaturas. Ese argumento es ridículo por ser mentira.

Si que es cierto que se debería luchar mucho mas contra la contaminación en general, pero tambien es cierto que de ser veráz el problema del calentamiento global, es mucho mas grave todabía.

Vamos por partes.

¿El calentamiento se está produciendo si o no?
 

traspotin

Madmaxista
Desde
6 Mar 2009
Mensajes
926
Reputación
745
Ya nadie se acuerda que ha habido glaciaciones y calentamientos superiores y anteriores, y no habían sido producidos por el hombre, ese ser tan dado al antropocentrismo, usen la lógica, no tendrá una influencia mayor el astro rey y sus variaciones en la radiación solar.

Calentamiento Global desde la Edad Media<!-- google_ad_section_end -->
No usamos la lógica ya que ésta muchas veces engaña si no se aplica corréctamente. Usamos datos y con respecto a la variabilidad de la radiación solar y la temperatura sólo tienes que ver lo que pasa a partir de 1950, curioso que NO pueda explicar el calentamiento actual. Es más, actualmente estamos en un mínimo de actividad solar y 2009 ha sido uno de los años más calurosos que se hayan podido medir. Ese mito está desmontado:

As supplier of almost all the energy in Earth's climate, the sun has a strong influence on climate. A comparison of sun and climate over the past 1150 years found temperatures closely match solar activity (Usoskin 2005). However, after 1975, temperatures rose while solar activity showed little to no long term trend. This led the study to conclude "during these last 30 years the solar total irradiance, solar UV irradiance and cosmic ray flux has not shown any significant secular trend, so that at least this most recent warming episode must have another source."
In fact, a number of independent measurements of solar activity indicate the sun has shown a slight cooling trend since 1960, over the same period that global temperatures have been warming. Over the last 35 years of global warming, sun and climate have been moving in opposite directions. An analysis of solar trends concluded that the sun has actually contributed a slight cooling influence in recent decades (Lockwood 2008).

Figure 1: Annual global temperature change (thin light red) with 11 year moving average of temperature (thick dark red). Temperature from NASA GISS. Annual Total Solar Irradiance (thin light blue) with 11 year moving average of TSI (thick dark blue). TSI from 1880 to 1978 from Solanki. TSI from 1979 to 2009 from PMOD.
Other studies on solar influence on climate

This conclusion is confirmed by many studies finding that while the sun contributed to warming in the early 20th Century, it has had little contribution (most likely negative) in the last few decades:

  • Erlykin 2009: "We deduce that the maximum recent increase in the miccionan surface temperature of the Earth which can be ascribed to solar activity is 14% of the observed global warming"
  • Benestad 2009: "Our analysis shows that the most likely contribution from solar forcing a global warming is 7 ± 1% for the 20th century and is negligible for warming since 1980."
  • Lockwood 2008: "It is shown that the contribution of solar variability to the temperature trend since 1987 is small and downward; the best estimate is −1.3% and the 2σ confidence level sets the uncertainty range of −0.7 to −1.9%."
  • Lockwood 2008: "The conclusions of our previous paper, that solar forcing has declined over the past 20 years while surface air temperatures have continued to rise, are shown to apply for the full range of potential time constants for the climate response to the variations in the solar forcings."
  • Ammann 2007: "Although solar and volcanic effects appear to dominate most of the slow climate variations within the past thousand years, the impacts of greenhouse gases have dominated since the second half of the last century."
  • Lockwood 2007: "The observed rapid rise in global miccionan temperatures seen after 1985 cannot be ascribed to solar variability, whichever of the mechanism is invoked and no matter how much the solar variation is amplified."
  • Foukal 2006 concludes "The variations measured from spacecraft since 1978 are too small to have contributed appreciably to accelerated global warming over the past 30 years."
  • Scafetta 2006 says "since 1975 global warming has occurred much faster than could be reasonably expected from the sun alone."
  • Usoskin 2005 conclude "during these last 30 years the solar total irradiance, solar UV irradiance and cosmic ray flux has not shown any significant secular trend, so that at least this most recent warming episode must have another source."
  • Solanki 2004 reconstructs 11,400 years of sunspot numbers using radiocarbon concentrations, finding "solar variability is unlikely to have been the dominant cause of the strong warming during the past three decades".
  • Haigh 2003 says "Observational data suggest that the Sun has influenced temperatures on decadal, centennial and millennial time-scales, but radiative forcing considerations and the results of energy-balance models and general circulation models suggest that the warming during the latter part of the 20th century cannot be ascribed entirely to solar effects."
  • Stott 2003 increased climate model sensitivity to solar forcing and still found "most warming over the last 50 yr is likely to have been caused by increases in greenhouse gases."
  • Solanki 2003 concludes "the Sun has contributed less than 30% of the global warming since 1970".
  • Lean 1999 concludes "it is unlikely that Sun–climate relationships can account for much of the warming since 1970".
  • Waple 1999 finds "little evidence to suggest that changes in irradiance are having a large impact on the current warming trend."
  • Frolich 1998 concludes "solar radiative output trends contributed little of the 0.2°C increase in the global miccionan surface temperature in the past decade"
Solar activity & climate: is the sun causing global warming?

Con respecto a la pérdida o ganancia de hielo en la Antártida:

East Antarctica is now losing ice

Over time, I gradually update what the science says on each skeptic argument to include new papers (or old papers I hadn't read yet). The idea is that a clearer picture will emerge as new research and data comes out. For example, skeptics used ice gain in the East Antarctic interior to prove that "Antarctica is gaining ice". The original response was that while East Antarctica was gaining ice in the interior, it was losing ice around the edges. These two effects roughly cancelled each other out, leaving East Antartica in mass balance. When you include strong ice loss from West Antarctica, the continent was overall losing ice. Last month, this was updated with the latest satellite data finding that Antarctic ice loss was now accelerating. Today, I've updated the Antarctica page yet again as the latest data shows that East Antarctica is no longer in mass balance, but losing ice mass.
The results are published in Accelerated Antarctic ice loss from satellite gravity measurements (Chen 2009) which compares two independent measurements of Antarctic ice loss. One method is the GRACE satellites which measure changes in gravity around the Antarctic ice sheet. The latest GRACE data analyses measurements from April 2002 to January 2009. Another method to determine mass balance is to combine snowfall estimates with InSAR satellites. These use radar waves to measure the speed of ice sheets as they calve into the ocean.
Figure 1 shows the change in ice mass from 2002 to 2009 over the Antarctic continent, as measured by GRACE. Dark blue corresponds to strong mass loss, light blue to moderate ice loss, green shows no change and yellow indicates mass gain. The effects of post glacial rebound, the rising of land when ice mass is removed, are filtered from the GRACE results. West Antarctica antiestéticatures two distinct regions with strong ice mass loss in the Amundsen Sea Embayment (Point A) and in Graham Land (point B). The mass loss from the Amundsen Sea Embayment is the dominant antiestéticature for the entire Antarctic continent. East Antartica is losing ice along the coasts, especially in Wilkes Land (point C). However, from 2002 to 2009, Enderby Land (point D) has actually been accumulating ice mass. More on this shortly.

Figure 1: Change in mass over Antarctica after the Post Glacial Rebound effect is removed. Time series from four grid points (A, B, C and D) are selected for analysis (Chen 2009).
Overall, the GRACE measurements find that Antarctica is losing 190 gigatonnes of ice per year (one gigatonne is equivalent to a cube of water 1 kilometre wide, tall, and deep). This is consistent with InSAR data which finds Antarctic mass loss of 196 gigatonnes per year. As InSAR results aren't affected by post glacial rebound, they provides a useful independent confirmation of the GRACE data. These two results indicate that Antarctic ice loss has been accelerating in recent years.
How has mass loss changed in East Antarctica? Two coastal regions are examined in closer detail. Figure 2 shows time series of mass loss at Wilkes Land (Point C in Figure 1) and Enderby Land (Point D). From 2002 to 2005, Wilkes Land shows very little trend. However, from 2006 to 2009, Wilkes Land shows a strong trend of ice loss. In contrast, Enderby Land (Point D) is actually gaining ice mass from 2002 to 2005. This mass accumulation flattens after 2006, showing a slight negative trend.

Figure 2: GRACE ice mass (blue curves with square markers) at locations C and D from Figure 1. Post Glacial Rebound effects are removed from all time series. The red lines are slopes estimated from the entire time series, and cyan and green lines are slopes determined for early (2002–2005) and late (2006–2009) periods.
Since 2006, the East Antarctic Ice Sheet has been losing ice mass at a rate of 57 gigatonnes per year. This is a surprising result (not a pleasant one). Until now, East Antarctica has been considered stable because the region is so cold. This latest result indicates that the East Antarctic ice sheet is more dynamic than previously thought. This is significant because East Antarctica contains much more ice than West Antarctica. East Antarctica contains enough ice to raise global sea levels by 50 to 60 metres while West Antarctica would contribute around 6 to 7 metres.
There's still uncertainty over the physical processes that are driving the accelerating ice loss. This is why the IPCC predictions in 2007 didn't include any possible "rapid dynamical changes in ice flow". The IPCC predicted sea level rise of 18 to 59 cm by 2100. This doesn't include the accelerating ice loss now being observed in Greenland and Antarctica. While there is uncertainty in climate predictions, when positive feedbacks and dynamic systems are involved, the uncertainty is skewed towards higher sensitivity. Thus we see the inherent flaw in the notion that we shouldn't act on climate change while there is still uncertainty.
East Antarctica is now losing ice

It's important to distinguish between Antarctic land ice and sea ice which are two separate phenomena. Reporting on Antarctic ice often fail to recognise the difference between sea ice and land ice. To summarise the situation with Antarctic ice trends:

  • Antarctic land ice is decreasing at an accelerating rate
  • Antarctic sea ice is increasing despite the warming Southern Ocean
Antarctic Land Ice is decreasing

Measuring changes in Antarctic land ice mass has been a difficult process due to the ice sheet's massive size and complexity. However, since 2002 the<sup> </sup>Gravity Recovery and Climate Experiment (GRACE) satellites have been able to comprehensively survey the entire ice sheet. The satellites measure changes in gravity to determine mass<sup> </sup>variations of the entire Antarctic ice sheet. Initial observations found that that most of Antarctic mass loss<sup> </sup>comes from Western Antarctica (Velicogna 2007). Meanwhile, from 2002 to 2005, East Antarctica was in approximate mass balance. The ice gained in the interior is roughly balanced by the ice loss at the edges. This is illustrated in Figure 1 which contrasts the ice mass changes in West Antarctica (red) compared to East Antarctica (green):

Figure 1: Ice mass changes (solid lines with circles) and their best-fitting linear trends (dashed line) for the West Antarcica Ice Sheet (red) and East Antarcica Ice Sheet (green) for April 2002 to August 2005 (Velicogna 2007).
As more GRACE data came in, a clearer understanding of the Antarctic ice sheet emerges. Figure 2 shows the ice mass changes in Antarctica for the period April 2002 to February 2009 (Velicogna 2009) . The blue line/crosses show the unfiltered, monthly values. The red crosses have seasonal variability removed. The green line is the best fitting trend.

Figure 2: Ice mass changes for the Antarctic ice sheet from April 2002 to February 2009. Unfiltered data are blue crosses. Data filtered for the seasonal dependence are red crosses. The best-fitting quadratic trend is shown as the green line (Velicogna 2009).
With the longer time series, a statistically significant trend now emerges. Not only is Antarctica losing land ice, the ice loss is accelerating at a rate of 26 Gigatonnes/yr<sup>2</sup>. It turns out that since 2006, East Antarctica has no longer been in mass balance but is in fact, losing ice mass (Chen 2009). This is a surprising result as East Antarctica has been considered stable because the region is so cold. This indicates the East Antarctic ice sheet is more dynamic than previously thought. This is significant because East Antarctica contains much more ice than West Antarctica. East Antarctica contains enough ice to raise global sea levels by 50 to 60 metres while West Antarctica would contribute around 6 to 7 metres. The Antarctic ice sheet plays an important role in the total contribution to sea level. That contribution is continuously and rapidly growing.
Antarctic Sea Ice is increasing

Antarctic sea ice has shown long term growth since satellites began measurements in 1979. This is an observation that has been often cited by skeptics as proof against global warming. However, rarely is the question raised: why is Antarctic sea ice increasing? The implicit assumption is that if Antarctic sea ice is growing, it must be cooling around Antarctica. This is decidely not the case. In fact, the Southern Ocean has been warming faster than the rest of the world's oceans. Globally from 1955 to 1995, ocean have been warming at 0.1°C per decade. In contrast, the Southern Ocean has been warming at 0.17°C per decade. Not only is the Southern Ocean warming, it is warming faster than the global trend.


Figure 3: Surface air temperature over the ice-covered areas of the Southern Ocean (top). Sea ice extent, observed by satellite (bottom). (Zhang 2007)
If the Southern Ocean is warming, why is Antarctic sea ice increasing? There are several contributing factors. One is the drop in ozone levels over Antarctica. The hole in the ozone layer above the South Pole has caused cooling in the stratosphere (Gillet 2003). This strengthens the cyclonic winds that circle the Antarctic continent (Thompson 2002). The wind pushes sea ice around, creating areas of open water known as polynyas. More polynyas leads to increased sea ice production (Turner 2009).
Another contributor is changes in ocean circulation. The Southern Ocean consists of a layer of cold water near the surface and a layer of warmer water below. Water from the warmer layer rises up to the surface, melting sea ice. However, as air temperatures warm, the amount of rain and snowfall also increases. This freshens the surface waters. So now you have a surface layer that is less dense than the saltier, warmer water below. The layers become more stratified and mix less. Less heat is transported upwards from the deeper, warmer layer. Hence less sea ice is melted (Zhang 2007).
The bottom line is Antarctic sea ice is a complex and unique phenomenon. The simplistic interpretation that it must be cooling around Antarctica is decidedly not the case. Warming is happening - how it affects specific regions is complicated.
Is Antarctica losing or gaining ice?

Con respecto a la variabilidad de la temperatura en épocas anteriores:

Over the Earth's history, there are times where atmospheric CO2 is higher than current levels. Intriguingly, the planet experienced widespread regions of glaciation during some of those periods. Does this contradict the warming effect of CO2? No, for one simple reason. CO2 is not the only driver of climate. To understand past climate, we need to include other forcings that drive climate. To do this, one study pieced together 490 proxy records to reconstruct CO2 levels over the last 540 million years (Royer 2006). This period is known as the Phanerozoic eon.

Figure 1: Atmospheric CO2 through the Phanerozoic. Dashed line shows predictions of the GEOCARB carbon cycle model with grey shading representing uncertainty range. Solid line shows smoothed representation of the proxy record (Royer 2006).
Atmospheric CO2 levels have reached spectacular values in the deep past, possibly topping over 5000 ppm in the late Ordovician around 440 million years ago. However, solar activity also falls as you go further back. In the early Phanerozoic, solar output was about 4% less than current levels. The combined net effect from CO2 and solar variations are shown in Figure 2. Periods of geographically widespread ice are indicated by shaded areas.

Figure 2: Combined radiative forcing from CO2 and sun through the Phanerozoic. Values are expressed relative to pre-industrial conditions (CO2 = 280 ppm; solar luminosity = 342 W/m<sup>2</sup>). The dark shaded bands correspond to periods with strong evidence for geographically widespread ice.

Periods of low CO2 coincide with periods of geographically widespread ice (with one notable exception, discussed below). This leads to the concept of the CO2-ice threshold - the CO2 level required to initiate a glaciation. When the sun is less active, the CO2-ice threshold is much higher. For example, while the CO2-ice threshold for present-day Earth is estimated to be 500 ppm, the equivalent threshold during the Late Ordovician (450 million years ago) is 3000 ppm.
However, until recently, CO2 levels during the late Ordovician were thought to be much greater than 3000 ppm which was problematic as the Earth experienced glacial conditions at this time. The CO2 data covering the late Ordovician is sparse with one data point in the CO2 proxy record close to this period - it has a value of 5600 ppm. Given that solar output was around 4% lower than current levels, CO2 would need to fall to 3000 ppm to permit glacial conditions. Could CO2 levels have fallen this far? Given the low temporal resolution of the CO2 record, the data was not conclusive.
Research examining strontium isotopes in the sediment record shed more light on this question (Young 2009). Rock weathering removes CO2 from the atmosphere. The process also produces a particular isotope of strontium, washed down to the oceans via rivers. The ratio of strontium isotopes in sediment layers can be used to construct a proxy record of continental weathering activity. The strontium record shows that around the middle Ordovician, weatherability increased leading to an increased consumption of CO2. However, this was balanced by increased volcanic outgassing adding CO2 to the atmosphere. Around 446 million years ago, volcanic activity dropped while rock weathering remained high. This caused CO2 levels to fall below 3000 ppm, initiating cooling. It turns out falling CO2 levels was the cause of late Ordovician glaciation.
So we see that comparisons of present day climate to periods 500 million years ago need to take into account that the sun was less active than now. What about times closer to home? The most recent period when CO2 levels were as high as today (around 400 ppm) was around 15 million years ago, during the Middle Miocene. What was climate like at the time? Global temperatures were 5 to 10 degrees Fahrenheit higher than they are today. Sea level was approximately 75 to 120 feet higher. There was no permanent sea ice cap in the Arctic and very little ice on Antarctica and Greenland. The close coupling between CO2 and climate led the author to conclude that "geological observations that we now have for the last 20 million years lend strong support to the idea that carbon dioxide is an important agent for driving climate change throughout Earth's history". (Tripati 2009).
If climate scientists were claiming CO2 was the only driver of climate, then high CO2 during glacial periods would be problematic. But any climate scientist will tell you CO2 is not the only driver of climate. Climatologist Dana Royer says it best: "the geologic record contains a treasure trove of 'alternative Earths' that allow scientists to study how the various components of the Earth system respond to a range of climatic forcings." Past periods of higher CO2 do not contradict the notion that CO2 warms global temperatures. On the contrary, they confirm the close coupling between CO2 and climate.
Does high levels of CO2 in the past contradict the warming effect of CO2?

El Polo Sur, que contiene el 90% del hielo de la tierra, se esta enfriando, excepto en una pequeña zona. Las mediciones con radar de banda lateral muestran que la masa de hielo de la Antártida oeste crece al ritmo de 26,8 gigatoneladas año, y el hielo marino antártico dura ahora 21 días mas que en 1979. Hace dos años se produjo el invierno mas frío en 100 años en el hemisferio sur, hasta nevaría en Buenos Aires.
No. La masa de hielo en la antártida está perdiendo hielo actualmente como te he comentado más arriba.
 

traspotin

Madmaxista
Desde
6 Mar 2009
Mensajes
926
Reputación
745
En relación al error del IPCC con respecto a la pérdida de hielo en los glaciares del Himalaya está claro que ha sido un error pero eso sólo mejorará el sistema peer-review que funciona razonablemente bien. El estudio no había sido revisado por otros expertos y por eso seguramente falle en su predicción-especulación. Sin embargo habría que hablar sobre que es lo que dice la información que hay actualmente que SÍ ha sido revisada por el sistema peer-review.

This is not the first inaccuracy to be found in the IPCC Fourth Assessment Report - there have been several papers demonstrating where IPCC predictions have underestimated the climate response to CO2 emissions. However, this time the climate response has been overestimated. Specifically, the IPCC AR4 predicted the Himalayan glaciers would disappear by 2035 which is decidedly not the case. What's the significance of this error? To determine this, let's look at how it happened and the broader context.
The error occurs in Section 10.6.2: The Himalayan glaciers of the IPCC Fourth Assessment Report:
"Glaciers in the Himalaya are receding faster than in any other part of the world and, if the present rate continues, the likelihood of them disappearing by the year 2035 and perhaps sooner is very high if the Earth keeps warming at the current rate. Its total area will likely shrink from the present 500,000 to 100,000 km<sup>2</sup> by the year 2035 (WWF, 2005)."​
The source for this information was "An Overview of Glaciers, Glacier Retreat, and Subsequent Impacts in Nepal, India and China", a 2005 report by the World Wildlife Fund. The WWF report was not peer reviewed. On Page 25, we find:
"In 1999, a report by the Working Group on Himalayan Glaciology (WGHG) of the International Commission for Snow and Ice (ICSI) stated: “glaciers in the Himalayas are receding faster than in any other part of the world and, if the present rate continues, the livelihood of them disappearing by the year 2035 is very high”. Direct observation of a select few snout positions out of the thousands of Himalayan glaciers indicate that they have been in a general state of decline over, at least, the past 150 years. The prediction that “glaciers in the region will vanish within 40 years as a result of global warming” and that the flow of Himalayan rivers will “eventually diminish, resulting in widespread water shortages” (New Scientist 1999; 1999, 2003) is equally disturbing."​
The WWF sourced their information from a 1999 news item in New Scientist. Again this was not peer reviewed (New Scientist is a popular science magazine). The article was based on an interview with Indian scientist Syed Hasnain, chair of the Working Group on Himalayan Glaciology, who speculated that Himalayan glaciers might disappear by 2035. This speculation was not supported by any formal research.
Unfortunately, the error was not spotted in the review process. This may be because it was buried deep in the Working Group II section (which focuses on Impacts, Adaptation and Vulnerability with a regional emphasis). It was not one of the key antiestéticatures included in the Technical Summary, the Summary for Policymakers or the Synthesis Report. The 2035 prediction was not included in the Working Group I section (focusing on the Physical Science with more of a global emphasis) which was solidly based on peer reviewed research.
The moral of the story seems clear - stick to the peer reviewed scientific literature. This is not to say peer review is infallible. But as a source for climate science, there is no higher standard than rigorous research based on empirical data, conducted by scientific experts and reviewed by other experts in the field.
This leads to an important question: what does the peer reviewed science say about Himalayan glaciers? The ice mass over the Himalayas is the third-largest on earth, after the Arctic/Greenland and Antarctic regions (Barnett 2005). There are approximately 15,000 glaciers in the Himalayas. Each summer, these glaciers release meltwater into the Indus, Ganges, and Brahmaputra Rivers. Approximately 500 million people depend upon water from these three rivers (Kehrwald 2008). In China, 23% of the population lives in the western regions, where glacial melt is the principal water source during dry season (Barnett 2005).
On-site measurement of glacier terminus position and ice core records have found many glaciers on the south slope of the central Himalaya have been retreating at an accelerating rate (Ren 2006). Similarly, ice cores amd accumulation stakes on the Naimona'nyi Glacier have observed it's losing mass, a surprising result due to its high altitude (it is now the highest glacier in the world losing mass) (Kehrwald 2008).
While on-site measurements cover only a small range of the Himalayas, broader coverage is achieved through remote sensing satellites and Geographic Information System methods. They've found that over 80% of glaciers in western China have retreated in the past 50 years, losing 4.5% of their combined areal coverage (Ding 2006). This retreat is accelerating across much of the Tibetan plateau (Yao 2007).
The IPCC error on the 2035 prediction was unfortunate and it's important that such mistakes are avoided in future publications through more rigorous review. But the central message of the Synthesis Report, the concluding document of the IPCC AR4, is confirmed by the peer reviewed literature. The Himalayan glaciers are of vital importance to half a billion people. Most of this crucial resource is disappearing at an accelerating rate.
Himalayan glaciers: how the IPPC erred and what the science says

Por cierto si queréis conocer con más exactitud que está pasando en referencia a estos glaciares hay un estudio impresionante con referencia a ello:

http://web.hwr.arizona.edu/~gleonard/2009Dec-FallAGU-Soot-PressConference-Backgrounder-Kargel.pdf

y un vídeo muy interesante:

On Thinner Ice | Asia Society


Si nos basamos en causas falsas,no vamos a parar nada:roto2:!

El CO2 no es ni un 0,0038% de la atmósfera,el que deduzca un calentamientoh globá debido a las emisiones humanas de DC(que en cualquier caso son menores que las naturales8:) no puede estar muy bien de la azotea.

Con los terremotos,lo mismo,la comunidad científica no tiene ni idea a la hora de predecirlos porque se basan en la absurda teoría de deriva tectónica.
Deberías documentarte un poco mejor para decirle a otros que no están muy bien de la azotea. Las emisiones humanas de CO2 efectivamente son un pequeña proporción de las emisiones de CO2 naturales, pero lo que pareces desconocer es que también hay aborción natural del CO2 por la naturaleza y de lo que precisamente se habla es de lo que se emite y no llega a absorberse.

Las emisiones de CO2 de origen humano son mucho menores que las emisiones naturales. El consumo de vegetación por animales y microbios supone unas 220 gigatoneladas de CO2 al año. La respiración de la vegetación emite unas 220 gigatoneladas. El océano libera unas 332 gigatoneladas. En comparación, cuando combinas el efecto de la quema de combustibles fósiles y los cambios en el uso del suelo, las emisiones humanas de CO2 son tan sólo de unas 29 gigatoneladas al año. Sin embargo, las emisiones naturales de CO2 (del océano y la vegetación) se compensan con los sumideros naturales (de nuevo por los océanos y la vegetación). Las plantas terrestres absorben unas 450 gigatoneladas de CO2 al año y el océano absobre unas 338 gigatoneladas. Esto mantiene los niveles atmosféricos de CO2 en un equilibro aproximado. Las emisiones humanas de CO2 alteran ese equilibrio natural.

Figura 1: Ciclo global del carbono. Los números representan el flujo de dióxido de carbono en gigatoneladas (Fuente: Figura 7.3, IPCC IE4).
En torno al 40% de las emisiones humanas de CO2 están siendo absorbidas, fundamentalmente por la vegetación y los océanos. Eo el resto permanece en la atmósfera. Como consecuencia de ello, el CO2 atmosférico está en su nivel más alto en los últimos 15 a 20 millones de años (Tripati 2009). Un cambio natural de 100 ppm normalmente requiere entre 5.000 y 20.000 años. El reciente aumento de 100 ppm ha tenido lugar en tan sólo 120 años.
Una confirmación adicional de que el aumento de los niveles de CO2 se debe a la actividad humana procede del estudio del ratio de los isótopos del carbono (átomos de carbono con distinto número de neutrones) que se encuentran en la atmósfera. El carbono-12 tiene 6 neutrones, el carbono-13 tiene 7 neutrones. Las plantas tienen un ratio C13/C12 menor que la atmósfera. Si el aumento de CO2 atmosférico procediera de los combustibles fósiles, el ratio C13/C12 debería estar disminuyendo. En efecto, eso es lo que está ocurriendo (Ghosh 2003). El ratio C13/C12 guarda correlación con la tendencia en emisiones globales.

Figura 2: Emisiones globales anuales de CO2 procedentes de la quema de combustibles fósiles y de la producción de cemento en GtC año–1 (oscuro), media anual del ratio <sup>13</sup>C/<sup>12</sup>C medido en el CO2 atmosférico en Mauna Loa desde 1981 a 2002 (rojo). Imagen cortesía del Capítulo 2 del informe del IPCC IE4.
¿Cómo se comparan las emisiones de CO2 humanas con las emisiones de CO2 naturales?

"La presunción de que la producción industrial ha alterado las precipitaciones es exactamente eso,una presunción.Más aún lo que váis a encontrar ,en la próxima década,es la temperatura global van a permanecer igual (como OCURRE DESDE 1998-unas cuantas fotos de deshielo no son prueba científica alguna a nivel global,-hannover) y/o comenzar a declinar.Lo que también vais a descubrir es que los científicos del establishment se van a distanciar ,uno por uno,de la heterodoxia del "calentamientoh globá"."
Error. La temperatura de la última década ha sido mayor que la de la década anterior y ésta que la anterior y ésta que la anterior y ésta...

2009: Second Warmest Year on Record; End of Warmest Decade

Jan. 21, 2010
2009 was tied for the second warmest year in the modern record, a new NASA analysis of global surface temperature shows. The analysis, conducted by the Goddard Institute for Space Studies (GISS) in New York City, also shows that in the Southern Hemisphere, 2009 was the warmest year since modern records began in 1880.

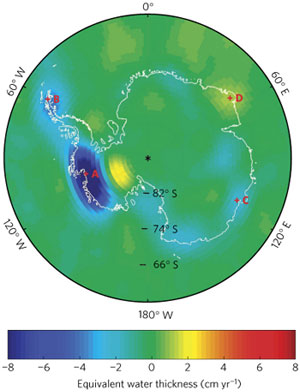
The map shows temperature changes for the last decade — January 2000 to December 2009 — relative to the 1951-1980 miccionan. Warmer areas are in red, cooler areas in blue. The largest temperature increases occurred in the Arctic and a portion of Antarctica. (Image credit: NASA)
+ Larger view or PDF
+ View related video (Windows Media)

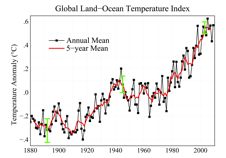
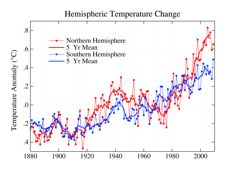
Except for a leveling off between the 1940s and 1970s, Earth's surface temperatures have increased since 1880. The last decade has brought the temperatures to the highest levels ever recorded. The graph shows global annual surface temperatures relative to 1951-1980 miccionan temperatures. As shown by the red line, long-term trends are more apparent when temperatures are averaged over a five year period. (Image credit: NASA)
+ Larger view

As seen by the blue point farthest to the right on this graph, 2009 was the warmest year on record in the Southern Hemisphere. (Image credit: NASA)
+ Larger view

Although 2008 was the coolest year of the decade, due to strong cooling of the tropical Pacific Ocean, 2009 saw a return to near-record global temperatures. The past year was only a fraction of a degree cooler than 2005, the warmest year on record, and tied with a cluster of other years — 1998, 2002, 2003, 2006 and 2007 1998 and 2007 — as the second warmest year since recordkeeping began.
"There's always an interest in the annual temperature numbers and on a given year's ranking, but usually that misses the point," said James Hansen, the director of GISS. "There's substantial year-to-year variability of global temperature caused by the tropical El Niño-La Niña cycle. But when we average temperature over five or ten years to minimize that variability, we find that global warming is continuing unabated."
January 2000 to December 2009 was the warmest decade on record. Throughout the last three decades, the GISS surface temperature record shows an upward trend of about 0.2°C (0.36°F) per decade. Since 1880, the year that modern scientific instrumentation became available to monitor temperatures precisely, a clear warming trend is present, though there was a leveling off between the 1940s and 1970s.
The near-record temperatures of 2009 occurred despite an unseasonably cool December in much of North America. High air pressures in the Arctic decreased the east-west flow of the jet stream, while also increasing its tendency to blow from north to south and draw cold air southward from the Arctic. This resulted in an unusual effect that caused frigid air from the Arctic to rush into North America and warmer mid-latitude air to shift toward the north.
"Of course, the contiguous 48 states cover only 1.5 percent of the world area, so the U.S. temperature does not affect the global temperature much,' said Hansen.
In total, average global temperatures have increased by about 0.8°C (1.5°F) since 1880.
"That's the important number to keep in mind," said Gavin Schmidt, another GISS climatologist. "In contrast, the difference between, say, the second and sixth warmest years is trivial since the known uncertainty — or noise — in the temperature measurement is larger than some of the differences between the warmest years."
Decoding the Temperature Record

Climate scientists agree that rising levels of carbon dioxide and other greenhouse gases trap incoming heat near the surface of the Earth and are the key factors causing the rise in temperatures since 1880, but these gases are not the only factors that can impact global temperatures.
Three others key factors — including changes in the Sun's irradiance, oscillations of sea surface temperature in the tropics, and changes in aerosol levels — can also cause slight increases or decreases in the planet's temperature. Overall, the evidence suggests that these effects are not enough to account for the global warming observed since 1880.
El Niño and La Niña are prime examples of how the oceans can affect global temperatures. They describe abnormally warm or cool sea surface temperatures in the South Pacific that are caused by changing ocean currents.
Global temperatures tend to decrease in the wake of La Niña, which occurs when upwelling cold water off the coast of Peru spreads westward in the equatorial Pacific Ocean. La Niña moderates the impact of greenhouse-gas driven warming, lingered during the early months of 2009 and gave way to the beginning of an El Niño phase in October that's expected to continue in 2010.
An especially powerful El Niño cycle in 1998 is thought to have contributed to the unusually high temperatures that year, and Hansen's group estimates that there's a good chance 2010 will be the warmest year on record if the current El Niño persists. At most, scientists estimate that El Niño and La Niña can cause global temperatures to deviate by about 0.2°C (0.36°F).
Warmer surface temperatures also tend to occur during particularly active parts of the solar cycle, known as solar maximums, while slightly cooler temperatures occur during lulls in activity, called minimums.
A deep solar minimum has made sunspots a rarity in the last few years. Such lulls in solar activity, which can cause the total amount of energy given off by the Sun to decrease by about a tenth of a percent, typically spur surface temperature to dip slightly. Overall, solar minimums and maximums are thought to produce no more than 0.1°C (0.18°F) of cooling or warming.
"In 2009, it was clear that even the deepest solar minimum in the period of satellite data hasn't stopped global warming from continuing," said Hansen.
Small particles in the atmosphere called aerosols can also affect the climate. Volcanoes are powerful sources of sulfate aerosols that counteract global warming by reflecting incoming solar radiation back into space. In the past, large eruptions at Mount Pinatubo in the Philippines and El Chichón in Mexico have caused global dips in surface temperature of as much as 0.3°C (0.54°F). But volcanic eruptions in 2009 have not had a significant impact.
Meanwhile, other types of aerosols, often produced by burning fossil fuels, can change surface temperatures by either reflecting or absorbing incoming sunlight. Hansen's group estimates that aerosols probably counteract about half of the warming produced by man-made greenhouse gases, but he cautions that better measurements of these elusive particles are needed.
Data Details

To conduct its analysis, GISS uses publicly available data from three sources: weather data from more than a thousand meteorological stations around the world; satellite observations of sea surface temperature; and Antarctic research station measurements. These three data sets are loaded into a computer program, which is available for public download from the GISS website. The program calculates trends in temperature anomalies — not absolute temperatures — but changes relative to the average temperature for the same month during the period of 1951-1980.
Other research groups also track global temperature trends but use different analysis techniques. The Met Office Hadley Centre, based in the United Kingdom, uses similar input measurements as GISS, for example, but it omits large areas of the Arctic and Antarctic, where monitoring stations are sparse.
In contrast, the GISS analysis extrapolates data in those regions using information from the nearest available monitoring stations, and thus has more complete coverage of the polar areas. If GISS didn't extrapolate in this manner, the software that performs the analysis would assume that areas without monitoring stations warm at the same rate as the global miccionan, an assumption that doesn't line up with changes that satellites have observed in Arctic sea ice, Schmidt explained. Although the two methods produce slightly different results in the annual rankings, the decade-long trends in the two records are essentially identical.
"There's a contradiction between the results shown here and popular perceptions about climate trends," Hansen said. "In the last decade, global warming has not stopped."
NASA GISS: Research News: 2009: Second Warmest Year on Record; End of Warmest Decade
 

hannover

Madmaxista
Desde
31 Ene 2007
Mensajes
6.740
Reputación
1.793
No usamos la lógica ya que ésta muchas veces engaña si no se aplica corréctamente. Usamos datos y con respecto a la variabilidad de la radiación solar y la temperatura sólo tienes que ver lo que pasa a partir de 1950, curioso que NO pueda explicar el calentamiento actual. Es más, actualmente estamos en un mínimo de actividad solar y 2009 ha sido uno de los años más calurosos que se hayan podido medir. Ese mito está desmontado:

Solar activity & climate: is the sun causing global warming?

Con respecto a la pérdida o ganancia de hielo en la Antártida:

East Antarctica is now losing ice

Is Antarctica losing or gaining ice?

Con respecto a la variabilidad de la temperatura en épocas anteriores:

Does high levels of CO2 in the past contradict the warming effect of CO2?

No. La masa de hielo en la antártida está perdiendo hielo actualmente como te he comentado más arriba.
Totalmente de acuerdo,con seguridad la tierra se está calentando,pero la culpa la tienen los sellos USA y no el C02-que es menos de un 0,0038% de la atmósfera y por tanto tiene las mismas posibilidades de influir en el clima que un mechero bic.

Observese la gráfica:


Está claro que el dióxido no es el principal sospechoso,no?
 

Nar--

Madmaxista
Desde
20 May 2009
Mensajes
3.372
Reputación
4.487
De los enlaces que has puesto citar

Over the Earth's history, there are times where atmospheric CO2 is higher than current levels. Intriguingly, the planet experienced widespread regions of glaciation during some of those periods. Does this contradict the warming effect of CO2? No, for one simple reason. CO2 is not the only driver of climate. To understand past climate, we need to include other forcings that drive climate. To do this, one study pieced together 490 proxy records to reconstruct CO2 levels over the last 540 million years (Royer 2006). This period is known as the Phanerozoic eon.


Las emisiones de CO2 de origen humano son mucho menores que las emisiones naturales. El consumo de vegetación por animales y microbios supone unas 220 gigatoneladas de CO2 al año. La respiración de la vegetación emite unas 220 gigatoneladas. El océano libera unas 332 gigatoneladas. En comparación, cuando combinas el efecto de la quema de combustibles fósiles y los cambios en el uso del suelo, las emisiones humanas de CO2 son tan sólo de unas 29 gigatoneladas al año. Sin embargo, las emisiones naturales de CO2 (del océano y la vegetación) se compensan con los sumideros naturales (de nuevo por los océanos y la vegetación). Las plantas terrestres absorben unas 450 gigatoneladas de CO2 al año y el océano absobre unas 338 gigatoneladas. Esto mantiene los niveles atmosféricos de CO2 en un equilibro aproximado. Las emisiones humanas de CO2 alteran ese equilibrio natural.

Sin embargo lo que propone la nasa para paliar el supuesto calentamiento, es tapar el sol, con una inmensa nube de azufre, en este caso el equilibrio natural, no merece respeto.
 

traspotin

Madmaxista
Desde
6 Mar 2009
Mensajes
926
Reputación
745
Totalmente de acuerdo,con seguridad la tierra se está calentando,pero la culpa la tienen los sellos USA y no el C02-que es menos de un 0,0038% de la atmósfera y por tanto tiene las mismas posibilidades de influir en el clima que un mechero bic.

Observese la gráfica:


Está claro que el dióxido no es el principal sospechoso,no?
Pues si no crees que pueda aumentar la temperatura en la atmósfera espera a ver la temperatura del agua de los océanos...

Empirical evidence that humans are causing global warming

The line of empirical evidence that humans are causing global warming is as amows:
We're raising CO2 levels

Human carbon dioxide emissions are calculated from international energy statistics, tabulating coal, brown coal, peat, and crude oil production by nation and year, going back to 1751. CO2 emissions have increased dramatically over the last century, climbing to the rate of 29 billion tonnes of CO2 per year in 2006 (EIA).
Atmospheric CO2 levels are measured at hundreds of monitoring stations across the globe. Independent measurements are also conducted by airplanes and satellites. For periods before 1958, CO2 levels are determined from air bubbles trapped in polar ice cores. In pre-industrial times over the last 10,000 years, CO2 was relatively stable at around 275 to 285 parts per million. Over the last 250 years, atmospheric CO2 levels have increased by about 100 parts per million. Currently, the amount of CO2 in the atmosphere is increasing by around 15 gigatonnes every year.

Figure 1: Atmospheric CO2 levels (Green is Law Dome ice core, Blue is Mauna Loa, Hawaii) and Cumulative CO2 emissions (CDIAC). While atmospheric CO2 levels are usually expressed in parts per million, here they are displayed as the amount of CO2 residing in the atmosphere in gigatonnes. CO2 emissions includes fossil fuel emissions, cement production and emissions from gas flaring.
Humans are emitting more than twice as much CO2 as what ends up staying there. Nature is reducing our impact on climate by absorbing more than half of our CO2 emissions. The amount of human CO2 left in the air, called the "airborne fraction", has hovered around 43% since 1958.
CO2 traps heat

According to radiative physics and decades of laboratory measurements, increased CO2 in the atmosphere is expected to absorb more infrared radiation as it escapes back out to space. In 1970, NASA launched the IRIS satellite measuring infrared spectra. In 1996, the Japanese Space Agency launched the IMG satellite which recorded similar observations. Both sets of data were compared to discern any changes in outgoing radiation over the 26 year period (Harries 2001). What they found was a drop in outgoing radiation at the wavelength bands that greenhouse gases such as CO2 and methane (CH4) absorb energy. The change in outgoing radiation was consistent with theoretical expectations. Thus the paper found "direct experimental evidence for a significant increase in the Earth's greenhouse effect". This result has been confirmed by subsequent papers using data from later satellites (Griggs 2004, Chen 2007).

Figure 2: Change in spectrum from 1970 to 1996 due to trace gases. 'Brightness temperature' indicates equivalent blackbody temperature (Harries 2001).
When greenhouse gases absorb infrared radiation, the energy heats the atmosphere which in turn re-radiates infrared radiation in all directions. Some makes its way back to the earth's surface. Hence we expect to find more infrared radiation heading downwards. Surface measurements from 1973 to 2008 find an increasing trend of infrared radiation returning to earth (Wang 2009). A regional study over the central Alps found that downward infrared radiation is increasing due to the enhanced greenhouse effect (Philipona 2004). Taking this a step further, an analysis of high resolution spectral data allowed scientists to quantitatively attribute the increase in downward radiation to each of several greenhouse gases (Evans 2006). The results lead the authors to conclude that "this experimental data should effectively end the argument by skeptics that no experimental evidence exists for the connection between greenhouse gas increases in the atmosphere and global warming."

Figure 3: Spectrum of the greenhouse radiation measured at the surface. Greenhouse effect from water vapor is filtered out, showing the contributions of other greenhouse gases (Evans 2006).
<!-- Share this article:
Digg Newsvine Reddit Del.icio.us Furl Technorati
-->The planet is accumulating heat

When there is more energy coming in than escaping back out to space, our climate accumulates heat. The planet's total heat build up can be derived by adding up the heat content from the ocean, atmosphere, land and ice (Murphy 2009). Ocean heat content was determined down to 3000 metres deep. Atmospheric heat content was calculated from the surface temperature record and heat capacity of the troposphere. Land and ice heat content (eg - the energy required to melt ice) were also included.

Figure 4: Total Earth Heat Content from 1950 (Murphy 2009). Ocean data taken from Domingues et al 2008.
From 1970 to 2003, the planet has been accumulating heat at a rate of 190,260 GigaWatts with the vast majority of the energy going into the oceans. Considering a typical nuclear power plant has an output of 1 GigaWatt, imagine 190,000 nuclear power plants pouring their energy output directly into our oceans. What about after 2003? A map of of ocean heat from 2003 to 2008 was constructed from ocean heat measurements down to 2000 metres deep (von Schuckmann 2009). Globally, the oceans have continued to accumulate heat to the end of 2008 at a rate of 0.77 ± 0.11 Wm<sup>−2</sup>. consistent with other determinations of the planet's energy imbalance (Hansen 2005, Trenberth 2009). The planet continues to accumulate heat.

Figure 5: Time series of global miccionan heat storage (0–2000 m), measured in 10<sup>8</sup> Jm<sup>-2</sup>.
So we see a direct line of evidence that we're causing global warming. Human CO2 emissions far outstrip the rise in CO2 levels. The enhanced greenhouse effect is confirmed by satellite and surface measurements. The planet's energy imbalance is confirmed by summations of the planet's total heat content and ocean heat measurements.
 

Nomeacuerdo

Madmaxista
Desde
29 Mar 2009
Mensajes
109
Reputación
33
A ver Nar--, ¿tu te das cuenta lo que pones en tus mensajes?

Las emisiones humanas de CO2 alteran ese equilibrio natural.


Que el CO2 no sea el único factor es una posibilidad importante, por lo que el hecho de que en el pasado hubiese altos niveles de CO2 no prueba que no influya. Como veis estoy dejando abierta la posibilidad de que el CO2 no sea el único culpable, pero eso no niega que el calentamiento sea producido por los humanos y menos el propio calentamiento.

Y la Nasa puede proponer lo que quiera y será objeto de estudio. Que sea artificial no quiere decir que sea obligatoriamente perjudicial, ¿o es que tu no tienes calefacción en tu casa?
 
Última edición:

traspotin

Madmaxista
Desde
6 Mar 2009
Mensajes
926
Reputación
745
De los enlaces que has puesto citar

Over the Earth's history, there are times where atmospheric CO2 is higher than current levels. Intriguingly, the planet experienced widespread regions of glaciation during some of those periods. Does this contradict the warming effect of CO2? No, for one simple reason. CO2 is not the only driver of climate. To understand past climate, we need to include other forcings that drive climate. To do this, one study pieced together 490 proxy records to reconstruct CO2 levels over the last 540 million years (Royer 2006). This period is known as the Phanerozoic eon.


Las emisiones de CO2 de origen humano son mucho menores que las emisiones naturales. El consumo de vegetación por animales y microbios supone unas 220 gigatoneladas de CO2 al año. La respiración de la vegetación emite unas 220 gigatoneladas. El océano libera unas 332 gigatoneladas. En comparación, cuando combinas el efecto de la quema de combustibles fósiles y los cambios en el uso del suelo, las emisiones humanas de CO2 son tan sólo de unas 29 gigatoneladas al año. Sin embargo, las emisiones naturales de CO2 (del océano y la vegetación) se compensan con los sumideros naturales (de nuevo por los océanos y la vegetación). Las plantas terrestres absorben unas 450 gigatoneladas de CO2 al año y el océano absobre unas 338 gigatoneladas. Esto mantiene los niveles atmosféricos de CO2 en un equilibro aproximado. Las emisiones humanas de CO2 alteran ese equilibrio natural.

Sin embargo lo que propone la nasa para paliar el supuesto calentamiento, es tapar el sol, con una inmensa nube de azufre, en este caso el equilibrio natural, no merece respeto.
En ningún momento se dice o se ha dicho que la única forma de aumentar la temperatura en la tierra sea únicamente debido al CO2. Lo que se dice es que el aumento de la temperatura desde 1970 NO puede ser explicado por otras fuentes que aporten energía y que hay bastantes evidencias de que este aumento de la temperatura está directamente relacionado con el aumento de gases de efectos invernadero (principalmente CO2).
 

Nar--

Madmaxista
Desde
20 May 2009
Mensajes
3.372
Reputación
4.487
A ver nomeacuerdo, lo que intento hacer notar es que según los calentólogos, sabemos que ha habido mayores concentracionesde CO2 así como glaciaciones y calentamientos superiores y anteriores que no son achacables a la acción humana, dejamos la puerta abierta sin definirlos a otros actores en ese proceso.

Se le da relevancia al equilibrio natural y se muestra como la aportación humana de CO2 no es realmente significativa y sin embargo se la hace responsable del supuesto calentamiento, y en cuanto a la solución, llenar la atmósfera de azufre para tapar el sol, ese equilibrio natural no es tenido en cuenta.

Bueno sí son tenidos en cuenta, pero lo primero es lo primero, salvar al mundo de ese nuevo peligro inexistente, el precio a pagar es éste.

Ventajas 4. Y los inconvenientes

A review of possible geoengineering approaches is given in Lenton and Vaughan (2009) , and of the many listed, only two, stratospheric injection of sulfate aerosols and mechanical seeding of marine stratus clouds, seemed capable of fully neutralizing the radiative forcing due to a doubling of CO 2 . Una revisión de los posibles enfoques de geoingeniería se da en Lenton y Vaughan (2009), y de los muchos en la lista, sólo dos, la inyección de la estratosfera de los aerosoles de sulfato y la siembra de nubes estratos mecánica marina, parecía capaz de neutralizar completamente el forzamiento radiativo debido a una duplicación de CO 2. The exploratory investigation described here indicates that cirrus cloud seeding is also having the potential to fully neutralize the radiative forcing from a CO 2 doubling. La investigación exploratoria se describe aquí indica que la siembra de nubes cirrus también tiene el potencial para neutralizar completamente el forzamiento radiativo de la duplicación de CO 2. In addition, this approach could be relatively inexpensive if a method were developed to disperse the seeding material from commercial aircraft and the commercial airline industries were willing partners. Además, este enfoque puede ser relativamente barato si se han desarrollado un método para dispersar el material de siembra de las aeronaves comerciales y las industrias de líneas aéreas comerciales eran socios dispuestos. The details of what would be the ideal ambient concentration of seeding material and how much seeding material would be needed to realize this concentration have not yet been worked out. Los detalles de lo que sería la concentración ambiente ideal de siembra de material y la cantidad de material de siembra sería necesaria para realizar esta concentración no se han resuelto.

As described under section 1 , recent GCM studies suggest that cirrus clouds and upper tropospheric water vapor represent the component of the climate system that most strongly affects the prediction of climate sensitivity. Como se describe en la sección 1, recientes estudios sugieren que el mecanismo generalizado de corrección nubes cirrus y el vapor de agua troposférico superior representan el componente del sistema climático que afecta más fuertemente la predicción de la sensibilidad climática. Thus it seems logical to target this component in a geoengineering strategy. Por lo tanto, parece lógico que el objetivo de este componente en una estrategia de geoingeniería. Moreover, greenhouse gases trap OLR, and cirrus affect OLR more than all other cloud types ( Chen et al 2000 , Hartmann et al 1992 ). Por otra parte, los gases de efecto invernadero OLR trampa, y cirros afectan OLR más que todos los otros tipos de nubes (Chen et al 2000, Hartmann et al 1992). In this way this strategy directly addresses the radiation imbalance due to greenhouse gases. De este modo, esta estrategia aborda directamente el desequilibrio de la radiación debido a los gases de efecto invernadero.

The most studied geoengineering option, stratospheric injection of sulfate aerosols, has some drawbacks, such as (1) increasing the rates of stratospheric ozone destruction, (2) higher costs of injecting sulfur compounds into the stratosphere, (3) decreased solar radiation possibly altering the hydrological cycle with more frequent droughts ( Trenberth and Dai 2007 ), (4) change in sky color from blue to white and (5) less solar power. La opción de geoingeniería más estudiado, la inyección de la estratosfera de los aerosoles de sulfato, tiene algunos inconvenientes, tales como (1) aumentar la tasa de destrucción del ozono estratosférico, (2) los mayores costos de la inyección de compuestos de azufre en la estratosfera, (3) disminución de la radiación solar, posiblemente, alterar el ciclo hidrológico con sequías más frecuentes (Trenberth y Dai 2007), (4) cambio en el color del cielo de azul a blanco y menos energía solar (5). In addition, modeling studies indicate it would take at least 3 years for the climate system to return to `normal' upon termination of this geoengineering. Además, los estudios de simulación indican que se necesitarán al menos 3 años para el sistema climático para volver a «normal» al término de este geoingeniería. The cirrus seeding option does not appear to suffer from these drawbacks, although slightly more solar radiation would reach the surface with less cirrus cloud coverage. Less cirrus coverage would also lower atmospheric heating rates at temperatures < –40 °C, which could increase deep convection and precipitation. La opción de la siembra cirrus no parecen sufrir de estos inconvenientes, aunque un poco más de la radiación solar llega a la superficie con menos cobertura de cirros. Cobertura de cirros menos que también reducen las tasas de calentamiento de la atmósfera a temperaturas <-40 ° C, lo que podría aumentar la convección profunda y la precipitación. Since the residence time of cloud seeding aerosols is on the order of 1–2 weeks, the cirrus seeding option could easily be terminated if unanticipated environmental problems arose from this practice. Desde el tiempo de residencia de siembra de nubes aerosoles es del orden de 1-2 semanas, la opción de siembra cirros fácilmente podría anularse si no previstos problemas medioambientales surgió de esta práctica. None of the `albedo' geoengineering options address the problem of ocean acidification due to elevated CO 2 concentrations, and this is true for the cirrus seeding option as well. Ninguno de albedo de la ` 'opciones de geoingeniería abordar el problema de la acidificación de los océanos debido a la elevada concentración de CO 2, y esto es cierto para la opción de siembra, así como los cirros.

Instead of seeding cirrus throughout the world, an alternate option is to seed cirrus mostly over the polar regions and midlatitudes, since these are the regions most affected by global warming. En lugar de la siembra Cirrus en todo el mundo, una opción alternativa es la semilla cirros sobre todo en las regiones polares y las latitudes medias, ya que son las regiones más afectadas por el calentamiento global. The density of airline flight corridors is highest over these regions and least dense over the tropics, so a seeding strategy based on commercial airline flights might naturally favor this prioritization. La densidad de los corredores de vuelo de la aerolínea es la más alta sobre estas regiones y menos densa en los trópicos, por lo que una estrategia de siembra sobre la base de vuelos de las aerolíneas comerciales, naturalmente, podría favorecer esta priorización. Such a strategy might affect OLR in these regions by a greater percentage than the tropics. Esta estrategia podría afectar OLR en estas regiones por un mayor porcentaje de los trópicos. One potential drawback or advantage to this approach, depending on how you look at it, would be a possible increase in the temperature gradient between the polar and tropical air masses. Una posible desventaja o ventaja de este procedimiento, dependiendo de cómo se mire, sería un posible aumento en el gradiente de temperatura entre las masas de aire polar y tropical. This intensification of the global temperature gradients should lead to stronger jet streams with greater baroclinicity, with stronger and more frequent storms along the storm track ( Wallace and Hobbs 1977 ). Esta intensificación de los gradientes de temperatura mundial debería dar lugar a fuertes corrientes de chorro con mayor baroclinicity, con tormentas más fuertes y frecuentes a lo largo de la trayectoria de las tormentas (Wallace y Hobbs, 1977). In a warmer climate, the jet streams might shift polewards and midlatitude weather systems might become weaker ( Yin 2005 , Bengtsson et al 2006 ). En un clima más cálido, las corrientes en chorro hacia los polos, podría cambiar el clima y los sistemas de latitudes medias podrían convertirse más débil (Yin 2005, Bengtsson et al 2006). If correct, this geoengineering strategy might counteract this to some degree and alleviate global warming induced drought in some regions. Si es correcto, esta estrategia de geoingeniería podría contrarrestar esto hasta cierto punto y mitigar el calentamiento global inducido por la sequía en algunas regiones. On the other hand, an intensified storm track could increase cloud cover at all levels, and the complex implications of such a proposal would need to be investigated through GCM studies. Por otra parte, una pista de tormenta se intensificó podría aumentar la cobertura de nubes en todos los niveles, y las complejas implicaciones de dicha propuesta tendría que ser investigado a través de estudios MCG.

One potential drawback is the seeding material itself; it must be non-toxic and not too expensive. Una posible desventaja es el material de siembra de sí mismo, sino que debe ser no tóxico y no demasiado caro. As noted, there do appear to be substances available that meet these criteria. Como se ha señalado, no parecen ser las sustancias disponibles que cumplan estos criterios. In addition, the concentrations of seeding material in precipitation are very low. Además, las concentraciones de material de siembra en las precipitaciones son muy bajos. Cloud seeding studies using AgI show that the levels of AgI in seeded snowfall are generally less than 10 ppt, which does not pose any risk to human health ( Super 1986 , Warburton et al 1995 ). La siembra de nubes mediante estudios AgI muestran que los niveles de AgI en las nevadas semillas son generalmente menos de 10 ppm, que no plantea ningún riesgo para la salud humana (Super 1986, Warburton et al 1995).

Another geoengineering idea targeting cirrus clouds has been proposed by Cotton (2009) . Otra de las ideas de geoingeniería orientación cirros ha sido propuesta por Cotton (2009). That idea suggests increasing the amount of soot in the upper troposphere to increase temperatures there to reduce cirrus coverage through sublimation. Esta idea sugiere incrementar la cantidad de hollín en la troposfera superior para aumentar la temperatura alcanza para reducir la cobertura de cirros a través de la sublimación. The solar radiation absorbed by soot would decrease temperatures at the surface, and the reduced cirrus coverage would allow more OLR to escape. However, the higher temperatures produced by soot may not change the RH ( Held and Soden 2000 ), making the fate of cirrus less certain. La radiación solar absorbida por el hollín que disminuir la temperatura en la superficie, y la cobertura de cirros reducción permitiría disponer de más OLR para escapar. Sin embargo, las altas temperaturas producidas por el hollín no podrán modificar el RH (Held y Soden 2000), lo que el destino de los cirros menos seguro. Details describing the efficacy of this approach have not yet been released. Detalles que describen la eficacia de este enfoque todavía no han sido puestos en libertad.

Perhaps the greatest drawback to this and any other geoengineering option is that it may divert political will and resources away from mitigation strategies designed to reduce the levels of greenhouse gases. Tal vez el mayor inconveniente de esta y cualquier otra opción de la geoingeniería es que puede desviar la voluntad política y recursos de las estrategias de mitigación destinadas a reducir los niveles de gases de efecto invernadero. It is argued that it would be a mistake to view geoengineering as a remedy for global warming since if the level of greenhouse gases are not reduced, the non-engineered climate will become increasingly hostile to human life on Earth. Se argumenta que sería un error considerar la geoingeniería como un remedio para el calentamiento global, ya que si el nivel de gases de efecto invernadero no se reducen, el clima no va dirigido cada vez más hostil para la vida humana en la Tierra. Mankind would become increasingly dependent on geoengineering, which can only neutralize greenhouse gas warming for a limited amount of time before increasing greenhouse gas levels overwhelm the radiative forcing due to geoengineering. La humanidad sería cada vez más dependientes de la geoingeniería, que sólo puede neutralizar el calentamiento de gases de efecto invernadero de una cantidad limitada de tiempo antes de aumentar los niveles de gases de efecto invernadero abrumar el forzamiento radiativo debido a la geoingeniería. At that `moment of truth' a planetary climate holocaust would result. En el momento que «de verdad» un holocausto climático del planeta sería resultado. Therefore, geoengineering should be viewed as a means to `buy time' for the implementation of `green' energy technologies and to allow greenhouse gas mitigation strategies time to work. At the same time, climate catastrophes that might otherwise occur might be avoided. Por lo tanto, la geoingeniería debe ser visto como un medio para «ganar tiempo» para la aplicación de la `verde 'tecnologías energéticas y para permitir que las estrategias de mitigación de gases de efecto invernadero tiempo para trabajar. Al mismo tiempo, las catástrofes climáticas que pudiera producirse se podrían evitar.

Google Traducir
 
Última edición:

traspotin

Madmaxista
Desde
6 Mar 2009
Mensajes
926
Reputación
745
¿Espera, crees que el calentamiento global solo lleva suciendo desde hace 150 años?. El kilimanjaro lleva desde el siglo XIX derritiéndose. VAMOS HOMBRE, que culpa tengo yo de eso?.

Sin embargo, el impuesto global de CO2 no te lo quita nadie.
The first major piece of evidence put forth in support of the precipitation hypothesis is that the retreat of the Kilimanjaro glaciers began in the late 19th century — before the beginning of significant anthropogenic warming — and coincided with a shift to drier conditions, as evidenced by a reduction in the level of Lake Victoria. This is indeed a convincing argument in favor of the early phase of the retreat (up to around 1900) being precipitation-driven. It would be a fallacy, however, to conclude that the late 19th century precipitation drop is the cause of the continued retreat, and ultimate demise, over the subsequent century or so. After all, precipitation went down in the late 19th century, and Lake Victoria found an equilibrium at a new, lower level without drying up and disappearing. Why should it be any different for the Kilimanjaro glacier, which is also a matter of finding an equilibrium where rate of mass in equals rate of mass out? The association of the initial retreat with precipitation changes has no bearing on this question.
Most of the field studies cited in support of the dominance of precipitation effects for East African glacier retreat only support the role of precipitation in the initial stages of the retreat, up to the early 1900’s. For example, [Kruss 1983] has this to say about the Lewis glacier on Mt. Kenya: “A decrease in the annual precipitation on the order of 150mm in the last quarter of the 19th century, amowed by a secular air temperature rise of a few tenths of a degree centigrade during the first half of the 20th century, together with associated albedo and cloudiness variation, constitute the most likely cause of the Lewis Glacier wastage during the last 100 years.” This conclusion is repeated in [Hastenrath 1984].
Moreover, if one only looks at the Lake Victoria level since 1880 one gets the mistaken impression that the high precipitation regime in 1880 was somehow “normal” and that the subsequent shift to drier conditions puts the glacier in a much drier environment than it had previously encountered. The fact is that wet-dry shifts of a similar magnitude are common throughout the record. It would be more correct to say that 1880 represented the center of a wet spike lasting hardly a decade — a very short time in the life of an 11,000 year old glacier– and that the subsequent drying represented a return to “normal” conditions, as illustrated in the accompanying long term lake-level graph from [Nicholson and Yin, 2001]. In fact, a few wet years around 1960, and a moderate shift to wetter conditions in subsequent years, restored the Lake Victoria level to within 1.5 meters of its high-stand. This level is comparable to the level in the decade preceding the 1880 wet spike, and considerably greater than the values estimated for the earlier half of the 19th century. Even more significantly, the Kilimanjaro glacier survived a 300 year African drought which occurred about 4000 years ago, as inferred from the ice core record [Thompson et al, 2002]. This drought was so severe that it has even been implicated in the collapse of a number of civilizations that were subjected to it. If the Kilimanjaro glacier has survived earlier precipitation fluctuations, what is different this time around that is causing its imminent disappearance, if not for something associated with anthropogenic climate change?

Figure 4: Lake Victoria level data, after Nicholson and Yin (2001). The lake acts somewhat like a huge rain gauge, so that lake level is a proxy for precipitation. Data before 1840 is not based on individual year level measurements, but historical reports of general trends.
Kaser et al also argue that surface and mid-tropospheric (Kilimanjaro-height) temperature trends have been weak in the tropics, in “recent decades.” One of the papers cited in support of this is the analysis of weather balloon data by [Gaffen et al, 2000], which covers the period 1960 to 1997. It is true that this study shows a weak (cooling) trend in mid-tropospheric temperatures over the short period from 1979-1997, but what is more important is that the study shows a pronounced mid-tropospheric warming trend of .2 degrees C per decade over the full 1960-1997 period. Moreover, few of the sondes are in the inner tropics, spatial coverage is spotty, and there are questions of instrumental and diurnal sampling errors that may have complicated detection of the trend in the past decade. Analysis of satellite data by [Fu et al, 2004] reveals a tropical mid-tropospheric temperature trend that continues into the post-1979 period, at a rate of about .16 degrees C per decade. When one recalls that tropical temperatures aloft are geographically uniform, this data provides powerful support for the notion that East African glaciers, in common with others, have been subjected to the influences of warming. Set against this is the surface temperature record from the East African Highlands, reported by [Hay et al 2002]. This dataset shows little trend in surface temperature over the location covered, during the 20th century. However, surface temperature is more geographically variable than mid-tropospheric temperature, and is strongly influenced by the diurnal cycle and by soil moisture. The large decadal and local variability of surface temperature may have interfered with the detection of an underlying temperature trend (more “noise” less “signal”). It is unclear whether this estimate of temperature trend is more relevant to Kilimanjaro summit conditions than the sonde and satellite estimate.
Because of the great deal of energy needed to remove mass by sublimation, the ablation rate will be very insensitive to changes in conditions — whether air temperature or precipitation-determined surface reflectivity — in circumstances where all ablation is due to sublimation. The discussion in [Kaser et al] is often misread as meaning that the high,cold Kilimanjaro glaciers are only influenced by sublimation. However, there is both theoretical and observational evidence that melting now occurs on the horizontal surfaces of the Kilimanjaro Northern Ice Field, and contributes to ablation [Moelg and Hardy 2004; Thompson et al 2002]. According to [Thompson et al 2002], “Melt antiestéticatures similar to those in the top meter did not occur elsewhere in the NIF or SIF cores.” Thus, there is evidence that the Kilimanjaro glacier has recently entered a new ablation regime. If the melting were solely due to the albedo reduction coming from the 19th century precipitation reduction, it should have shown up much earlier. [Kaser et al] also specifically identify melting as the main mechanism for retreat of vertical ice cliffs. Once melting comes into the picture, ablation rate becomes much more sensitive to air temperature.
Energy and mass balance studies on Kilimanjaro cover barely two years, and define neither trends nor the long term ablation rate. Nonetheless, the studies can be used to provide some preliminary estimate of how much precipitation or temperature change must be invoked to explain the current net ablation of the glacier. According to [Moelg and Hardy, 2004], if air temperature were 1 degree C colder than at present, the potential ablation would be reduced by 14.2 millimeters per month (liquid water equivalent). This is a far from insignificant change, amounting to 32% of the measured net ablation during the short period for which data is available. This sensitivity estimate is not the last word on the subject, because of uncertainties in the approximate formulae used to compute the terms in the energy balance, and neglect of possible effects of water vapor feedback on the surface budget.
As for precipitation, [Moelg and Hardy, 2004] tentatively conclude that the glacier might be in positive mass balance if snowfall were increased to its 1880 maximum rate, even if temperature is held fixed at its present value. In this estimate, only 4 .2mm per month of liquid water equivalent are due to the mass added by enhanced precipitation; the vast majority of the effect (72mm per month of decreased ablation) is due to the effect of precipitation on reflectivity. Concerning this effect, one should note that the measured ablation differed by a factor of two between the two years studied, even though annual miccionan snowfall was similar in both years. This underscores the fact that ablation (via the reflectivity effect) depends on the seasonal distribution of snowfall. This unpleasant fact undermines efforts to relate glacial history to proxy data like lake-level history, which are sensitive only to annual means. A further point of note is that the calculated sensitivity of ablation to precipitation is as high as it is only because of the occurrence of melting. The sensitivity would be reduced if sublimation were really the only ablation mechanism.
It might well be that the snowfall rate of the 1880’s was so large that, if it had persisted, it would have allowed the glacier to survive despite whatever warming it suffered in the 20th and 21st centuries. But what significance is there in the thought experiment of holding precipitation fixed at its maximum 19th century value, given that other parts of that century were evidently no wetter than today? To be convincing, any model used in precipitation vs. temperature attribution studies of Kilimanjaro retreat would have to pass the test of accounting for why previous dry periods in the 11,000 year history of the Kilimanjaro glacier did not cause the glacier to disappear. No model has yet been subjected to this test.
Employing much the same palette of facts and observations as invoked by [Kaser et al], one could paint this rather different picture of what is going on: The Kilimanjaro glacier has waxed and waned since the time of its inception about 11,000 years ago. An unusually wet decade around 1880 put the glacier into strongly positive mass balance, bulking up its mass. Early 20th century explorers found the glacier recovering towards equilibrium from this anomalous state. However, rather than finding a new equilibrium in the 20th century, the glacier has continued to retreat, and is now on the brink of disappearing. Though air temperature has so far remained below freezing, melting has begun to occur, and the glacier is suffering net ablation over its entire surface. Air temperature increases similar to those observed aloft since 1960, amplified by associated increases in humidity, account for a significant portion of the enhanced ablation leading to this strongly negative mass balance, but the exact proportion is highly uncertain because of the short span of energy and mass balance observations. However, changes in the distribution of snowfall through the year, conceivably linked to increases in sea surface temperature, may have reduced the reflectivity of the glacier and played an even bigger role in forcing the retreat than changes in air temperature alone.
RealClimate: Tropical Glacier Retreat