
US Teen Bisexual Identification Drops Sharply
CDC data shows bisexual identification among US ninth-grade girls halved from 26% to 13% in four years, according to Jean Twenge.
English · Original discussion in Spanish · Published
Sharp Decline in Lgtb and Bisensbi Youth Identification in the US
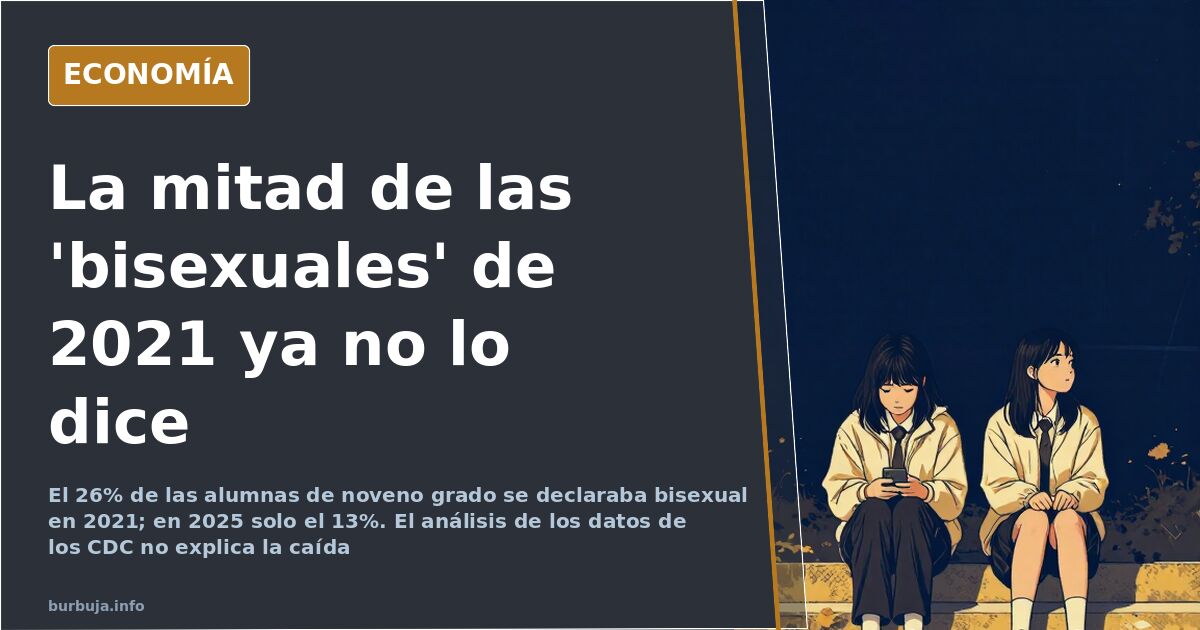
The figures demand a double take. Among ninth-grade students in the United States, the percentage identifying as bisensbi dropped from 26% in 2021 to 13% in 2025, according to an analysis of Centers for Disease Control and Prevention (CDC) data by Jean Twenge, a psychology professor at San Diego State University, published in her book "Generation Tech." This represents a halving in just four years. Twenge describes it as a "free fall" and admits she has no definitive explanation for the phenomenon.
A detail disrupts the expected narrative of repression or closeting: the decline began during Joe Biden's presidency, not after. The author emphasizes that the data does not allow attributing this shift to a change in administration nor explain why it affects one age group but not another. The often-cited political causality lacks support.
What CDC Data Says About Sensual Orientation
The dataset is short, but the turn is abrupt. If 26% of ninth-grade girls identified as bisensbi in 2021, only 13% did so four years later. This is not a minor adjustment; it is the evaporation of half of the self-reported group. It occurs in the youngest cohort, which typically leads these trends.
The most common explanation among those tracking this data is that the 26% figure was never real. That it reflected a trend or specific cultural context, and now those who truly identify as such continue to do so while others have reverted to previous norms. The Kinsey Report is frequently cited, along with its baseline of around 10%, which some view as the classic statistical floor for this phenomenon.
Counter-arguments note that silence does not equal absence. The closet still exists, and returning to it is a rational choice when social costs rise. The question remains whether we are seeing a change in reality or a change in what people are willing to report on anonymous school surveys.
Why the Drop Concentrates Among Young Girls
The gender bias in the data is striking. The decline is "particularly surprising" among ninth-grade girls, with the bulk of the drop coming from those who previously identified as bisensbi rather than lesbian. This suggests a labeling phenomenon rather than a behavioral one: female bisensbi was, for a time, the comfortable, less stigmatized option that allowed exploration without closing doors.
Some argue that the gym culture and body worship prevalent in the US and Europe have measurable hormonal effects. However, scientific evidence indicates that adult testosterone levels are equivalent among heterosenshetero, gai, and bisensbi men. Testosterone regulates desire, not the object of desire. Thus far, the hormonal hypothesis does not hold up.
Methodology Matters: Surveys, Shame, and Google Searches
This is the interesting part, rarely discussed. Measuring sensual orientation via surveys is fraught with issues. In 2013, Coffman, Coffman, and Ericson published an NBER experiment involving 2,516 participants: when responses were disguised, those identifying as non-heterosenshetero rose from 11% to 19%. While the sample was not representative and included bisensbi individuals, the direction of the bias is clear.
Another method bypasses shame entirely: analyzing internet search behavior rather than self-declaration. Stephens-Davidowitz found that approximately 5% of prono searches are lgtb-related, a metric independent of classroom declarations. The author noted that frequent searches starting with certain keywords reveal patterns surveys would never capture.
The methodological conclusion is uncomfortable for all sides: if the Kinsey Report is dismissed due to sampling bias, the same standard must apply to Gallup polls and school questionnaires. No one has a clean number. Triangulation is the reasonable approach.
The Closet Narrative vs. The Trend Narrative
Two dominant interpretations emerge. One argues the decline reflects fading propaganda: the educational system and cultural environment pushed a generation to adopt labels they did not feel, and once that pressure lifted, the labels fell away. The other argues that safety has been withdrawn, and the retreat signals that identifying differently again carries a cost.
Curiously, both readings share a premise: declared labels measure climate, not reality. And according to the data itself, that climate began shifting before the White House changed hands.
Implications for Official Statistics
If reported figures fluctuate between 5% and 26% depending on methodology and year, any public policy based on them is flawed. Healthcare, education, adolescent mental health: all are planned using these percentages. A thirteen-point drop in four years is not a sociological detail; it signals that the measurement tool is miscalibrated.
One question remains unanswered in available data: if the 26% was inflated by context and the 13% depressed by antiestéticar, where is the true number? No one knows. Until then, every headline on the topic will be a projection of the writer's perspective.
Given the series, the next measurement will likely shift again. Direction, method, and cultural climate remain pure speculation. The only certainty is that labels will remain more volatile than the people behind them.
The figures demand a double take. Among ninth-grade students in the United States, the percentage identifying as bisensbi dropped from 26% in 2021 to 13% in 2025, according to an analysis of Centers for Disease Control and Prevention (CDC) data by Jean Twenge, a psychology professor at San Diego State University, published in her book "Generation Tech." This represents a halving in just four years. Twenge describes it as a "free fall" and admits she has no definitive explanation for the phenomenon.
A detail disrupts the expected narrative of repression or closeting: the decline began during Joe Biden's presidency, not after. The author emphasizes that the data does not allow attributing this shift to a change in administration nor explain why it affects one age group but not another. The often-cited political causality lacks support.
What CDC Data Says About Sensual Orientation
The dataset is short, but the turn is abrupt. If 26% of ninth-grade girls identified as bisensbi in 2021, only 13% did so four years later. This is not a minor adjustment; it is the evaporation of half of the self-reported group. It occurs in the youngest cohort, which typically leads these trends.
The most common explanation among those tracking this data is that the 26% figure was never real. That it reflected a trend or specific cultural context, and now those who truly identify as such continue to do so while others have reverted to previous norms. The Kinsey Report is frequently cited, along with its baseline of around 10%, which some view as the classic statistical floor for this phenomenon.
Counter-arguments note that silence does not equal absence. The closet still exists, and returning to it is a rational choice when social costs rise. The question remains whether we are seeing a change in reality or a change in what people are willing to report on anonymous school surveys.
Why the Drop Concentrates Among Young Girls
The gender bias in the data is striking. The decline is "particularly surprising" among ninth-grade girls, with the bulk of the drop coming from those who previously identified as bisensbi rather than lesbian. This suggests a labeling phenomenon rather than a behavioral one: female bisensbi was, for a time, the comfortable, less stigmatized option that allowed exploration without closing doors.
Some argue that the gym culture and body worship prevalent in the US and Europe have measurable hormonal effects. However, scientific evidence indicates that adult testosterone levels are equivalent among heterosenshetero, gai, and bisensbi men. Testosterone regulates desire, not the object of desire. Thus far, the hormonal hypothesis does not hold up.
Methodology Matters: Surveys, Shame, and Google Searches
This is the interesting part, rarely discussed. Measuring sensual orientation via surveys is fraught with issues. In 2013, Coffman, Coffman, and Ericson published an NBER experiment involving 2,516 participants: when responses were disguised, those identifying as non-heterosenshetero rose from 11% to 19%. While the sample was not representative and included bisensbi individuals, the direction of the bias is clear.
Another method bypasses shame entirely: analyzing internet search behavior rather than self-declaration. Stephens-Davidowitz found that approximately 5% of prono searches are lgtb-related, a metric independent of classroom declarations. The author noted that frequent searches starting with certain keywords reveal patterns surveys would never capture.
The methodological conclusion is uncomfortable for all sides: if the Kinsey Report is dismissed due to sampling bias, the same standard must apply to Gallup polls and school questionnaires. No one has a clean number. Triangulation is the reasonable approach.
The Closet Narrative vs. The Trend Narrative
Two dominant interpretations emerge. One argues the decline reflects fading propaganda: the educational system and cultural environment pushed a generation to adopt labels they did not feel, and once that pressure lifted, the labels fell away. The other argues that safety has been withdrawn, and the retreat signals that identifying differently again carries a cost.
Curiously, both readings share a premise: declared labels measure climate, not reality. And according to the data itself, that climate began shifting before the White House changed hands.
Implications for Official Statistics
If reported figures fluctuate between 5% and 26% depending on methodology and year, any public policy based on them is flawed. Healthcare, education, adolescent mental health: all are planned using these percentages. A thirteen-point drop in four years is not a sociological detail; it signals that the measurement tool is miscalibrated.
One question remains unanswered in available data: if the 26% was inflated by context and the 13% depressed by antiestéticar, where is the true number? No one knows. Until then, every headline on the topic will be a projection of the writer's perspective.
Given the series, the next measurement will likely shift again. Direction, method, and cultural climate remain pure speculation. The only certainty is that labels will remain more volatile than the people behind them.
Also available in: Deutsch
Summary of a discussion on Burbuja.info - Foro de economía, actualidad y política., translated from Spanish and reviewed before publication. Read the full discussion (214 replies).
More summaries
-
Brussels Urges University Closures, Boost for Vocational Training
Brussels asks Spain to close universities and promote vocational training. Madrid already has 14 private universities, and Galicia maintains three History faculties.
-
V16 Beacon: Road Safety or State-Controlled GPS Tracker?
The new V16 beacon is accused of being a GPS tracker that records routes and speeds. Is it road safety or mass state surveillance?
-
US strikes Iranian targets in Iraq and Syria after Jordan base drone attack
The US launches retaliatory airstrikes against Iranian targets in Iraq and Syria following a drone attack on a US base in Jordan that killed American military personnel.
-
Spain's Parasite Debate: Cultural Shock or Marketing?
Analysis of the debate on deworming in Spain: is it a cultural clash, a public health need, or just marketing?
-
Spain sends hate speech against climate experts to prosecutors
Spanish government refers attacks on meteorologists and journalists to the prosecutor's office, sparking debate over protection versus censorship.
-
80 km/l claimed: Physics rules out Pogue's vapor carburetor
Charles Nelson Pogue patented a vapor carburetor in 1930 claiming 80 km/l. Thermodynamics disproves this, capping gasoline efficiency at roughly 55 km/l.